This is a median-joined calculation.
Analysis done by L. David Roper
roperld@vt.edu
http://arts.bev.net/roperldavid
www.roperld.com
The data are:
| Kit # | DYS# | 393 | 390 | 19(394) | 391 | 385a | 385b | 426 | 388 | 439 | 389-1 | 392 | (389-2)-(389-1) | 458 | 459a | 459b | 455 | 454 | 447 | 437 | 448 | 449 | 464a | 464b | 464c | 464d |
| 683 | Devin1 | 13 | 23 | 14 | 10 | 10 | 14 | 12 | 12 | 11 | 13 | 13 | 15 | 16 | 9 | 10 | 11 | 11 | 26 | 15 | 19 | 29 | 15 | 15 | 17 | 17 |
| 1408 | Devin2 | 13 | 23 | 14 | 10 | 10 | 14 | 12 | 12 | 11 | 13 | 13 | 15 | 16 | 9 | 10 | 11 | 11 | 26 | 15 | 19 | 29 | 15 | 15 | 17 | 17 |
| 682 | Devin3 | 13 | 24 | 14 | 11 | 11 | 15 | 12 | 12 | 12 | 13 | 13 | 16 | 17 | 9 | 10 | 11 | 11 | 25 | 15 | 19 | 30 | 15 | 15 | 16 | 17 |
| 4478 | Devin4 | 13 | 24 | 14 | 11 | 11 | 15 | 12 | 12 | 11 | 12 | 13 | 16 | 17 | 9 | 10 | 11 | 11 | 25 | 15 | 19 | 30 | 15 | 15 | 16 | 17 |
| 4459 | Devin5 | 13 | 24 | 14 | 11 | 11 | 15 | 12 | 12 | 11 | 13 | 13 | 16 | 17 | 9 | 10 | 11 | 11 | 25 | 15 | 19 | 31 | 15 | 15 | 16 | 17 |
| 1403 | Devin8 | 13 | 25 | 15 | 11 | 12 | 14 | 12 | 12 | 12 | 13 | 14 | 16 | 17 | 9 | 10 | 11 | 11 | 25 | 15 | 18 | 31 | 14 | 16 | 16 | 17 |
| 8681 | Devin9 | 13 | 24 | 14 | 11 | 11 | 15 | 12 | 12 | 11 | 12 | 13 | 16 | 16 | 9 | 10 | 11 | 11 | 25 | 15 | 19 | 30 | 15 | 15 | 16 | 18 |
| 9651 | Devn11 | 13 | 24 | 14 | 11 | 11 | 15 | 12 | 12 | 11 | 13 | 13 | 16 | 17 | 9 | 10 | 11 | 11 | 25 | 15 | 19 | 31 | 15 | 15 | 16 | 17 |
These data are from Donn Devine.
DYS389I=DYS389a is subtracted from DYS389II to give DYS389b. If one does not do this one can get either one too many or one too few relative mutations. See Y-Chromosome Markers for Many Families.
The relative mutations among these individuals are:
| Relative Mutations |
Devine1 | Devine2 | Devine3 | Devine4 | Devine5 | Devine8 | Devine9 | Devine11 |
| Devine1 | 0 | |||||||
| Devine2 | 0 | 0 | ||||||
| Devine3 | 10 | 10 | 0 | |||||
| Devine4 | 10 | 10 | 2 | 0 | ||||
| Devine5 | 10 | 10 | 2 | 2 | 0 | |||
| Devine8 | 17 | 17 | 9 | 11 | 9 | 0 | ||
| Devine9 | 10 | 10 | 4 | 2 | 4 | 13 | 0 | |
| Devine11 | 10 | 10 | 2 | 2 | 0 | 9 | 4 | 0 |
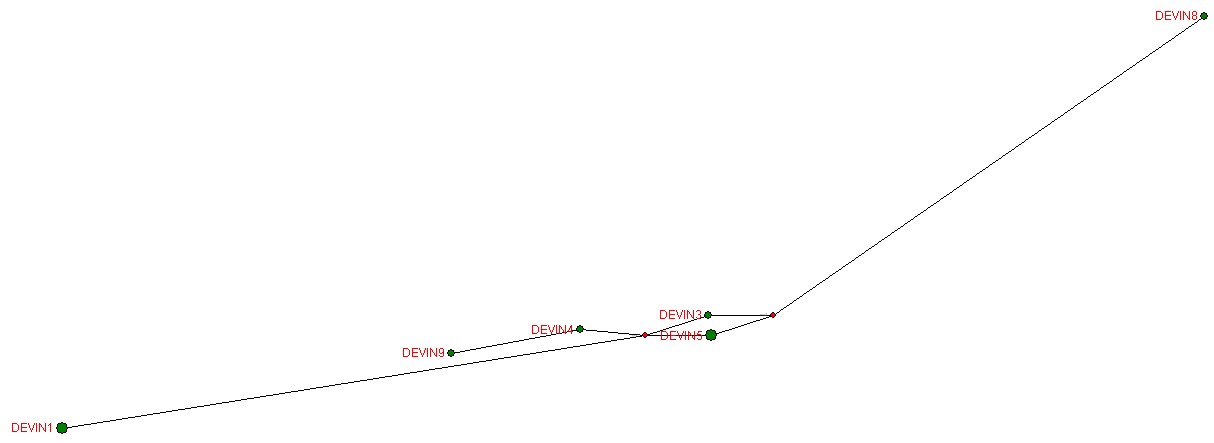
A way to look at the results is through a phylogenetic network. I use the free software of Fluxus Engineering (http://www.fluxus-engineering.com/sharenet.htm) to calculate and draw a network. (There are usually several possible networks for any given set of markers, but I present only the simplest looking one calculated by the program.) The phylogenetic network diagram is a visual way to see the genetic distances or relative mutations among the participants.
Another way to look at the results is through a phylogenetic network. I use the free software of Fluxus Engineering (http://www.fluxus-engineering.com/sharenet.htm) to calculate and draw a network. (The official brief instructions for using the program are at http://www.fluxus-engineering.com/netwinfaq.htm. I have some further instructions at Brief Instructions for Using the Phylogenetic Network Program) (There are usually several possible networks for any given set of markers, but I present only the simplest looking one calculated by the program.) The phylogenetic network diagram is a visual way to see the genetic distances or relative mutations among the participants.
A phylogenetic network for these individuals is:
This is a median-joined calculation. |
| Devine2 and Devine1 are the same. Devine5 and Devine11 are the same. |
To create time-ordered phylograms of the various paleolithic groups, I use the PHYLIP Neighbor software, with the UPGMA option (Unweighted Pair Group Method with Arithmetic Mean), and the relative-mutations matrix to generate a tree file (*.tre) to be plotted by the TreeView software. (For a description of how I do it, see PHYLIPTreeViewUse.htm.)
Here is a time-ordered phylogram for the Devine families:
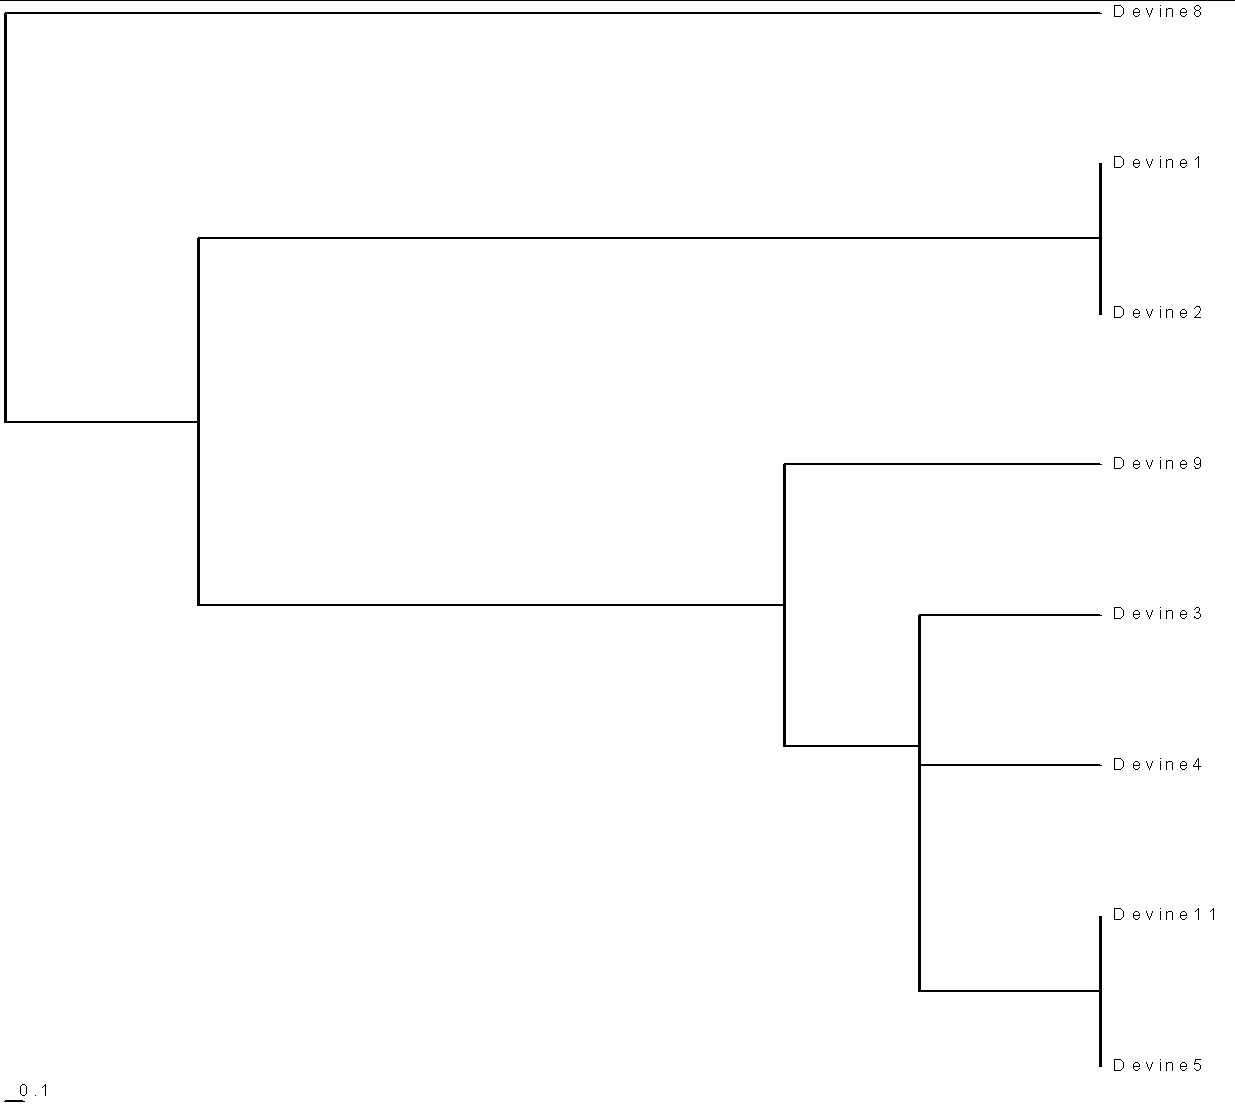 |
| Present time is on the right. Note the horizontal scale of 0.1 relative mutations on the bottom left. 1 relative mutation is about 500 years. |
To determine the haplogroups:
| Haplogroups (prefix DYS) |
19(394) | 388 | 390 | 391 | 392 | 393 | hg 1 | hg 2 | hg 3 | hg 9 | hg 16 | hg 21 |
| hg 1 | 14 | 12 | 24 | 11 | 13 | 13 | 0 | 7 | 6 | 9 | 4 | 4 |
| hg 2 | 14 | 14 | 22 | 10 | 11 | 13 | 7 | 0 | 7 | 4 | 9 | 5 |
| hg 3 | 16 | 12 | 25 | 10 | 11 | 13 | 6 | 7 | 0 | 9 | 8 | 4 |
| hg 9 | 14 | 16 | 23 | 10 | 11 | 12 | 9 | 4 | 9 | 0 | 11 | 7 |
| hg 16 | 15 | 12 | 23 | 11 | 14 | 14 | 4 | 9 | 8 | 11 | 0 | 8 |
| hg 21 | 13 | 12 | 24 | 10 | 11 | 13 | 4 | 5 | 4 | 7 | 8 | 0 |
| Devine1 | 14 | 12 | 23 | 10 | 13 | 13 | 2 | 5 | 6 | 7 | 4 | 4 |
| Devine2 | 14 | 12 | 23 | 10 | 13 | 13 | 2 | 5 | 6 | 7 | 4 | 4 |
| Devine3 | 14 | 12 | 24 | 11 | 13 | 13 | 0 | 7 | 6 | 9 | 4 | 4 |
| Devine4 | 14 | 12 | 24 | 11 | 13 | 13 | 0 | 7 | 6 | 9 | 4 | 4 |
| Devine5 | 14 | 12 | 24 | 11 | 13 | 13 | 0 | 7 | 6 | 9 | 4 | 4 |
| Devine8 | 15 | 12 | 25 | 11 | 14 | 13 | 3 | 10 | 5 | 12 | 3 | 7 |
| Devine9 | 14 | 12 | 24 | 11 | 13 | 13 | 0 | 7 | 6 | 9 | 4 | 4 |
| Devine11 | 14 | 12 | 24 | 11 | 13 | 13 | 0 | 7 | 6 | 9 | 4 | 4 |
We see that most Devines are in or closest to hg 1, 1.15+.