
L. David Roper
http://www.roperld.com/personal/roperldavid.htm
6 April, 2016
Home owners need to reduce their energy usage as fossil-fuels availability decreases.
After some study I decided to use The Energy Detective Model 5000-C. To use it one should have a home-network router; however, with more work just a computer will work. A less expensive model, TED 5000-G, does not include the not-needed display.
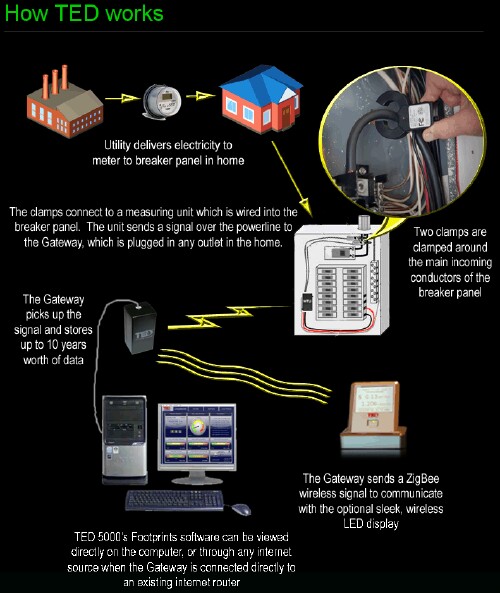
The components of TED 5000-C are:
A signal of the energy usage is fed from the MTU through the electric lines in the house to the Gateway. Automatic Footprint software is available from the Gateway to display usage on a computer screen.
TED has excellent web pages abour installing TED, including an installation pictorial and installation manual.
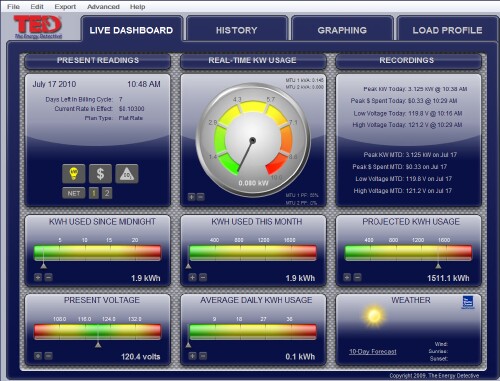
After the hardware is installed, the dashboard is displayed on an Internet browser with the URL http://ted5000/Footprints.html for the TED 5000 unit. The dashboard users manual is at http://www.theenergydetective.com/media/ted5000-usermanual.pdf .
It will probably be impossible to install the gateway in your computer room, because it is very sensitive to noise generated back into the electric line by devices, especially surge protectors. I found that I had to install the Gateway in a room two rooms away from the computer room, where I had a router connected to our network; and I could not use a surge protector anywhere in that room. TED sells an in-line wired noise filter to be installed in the breaker box.
The wireless display communicates with the gateway by the Zigbee low-power wireless protocol. It needs to be near the gateway for good signal reception; the are reception bars at the top right, similar to cell-phone bars.
The display shows 0 when it is updating; be patient and it will then show the updated data.
The base charges a battery in the display, so you can take the display away from the base to other locations. When away from the base, it will dim or turn off, but you can turn it back on by pressing the button.
When on the base you can hold down the button for 30 seconds to see the specifications of the display.
There is a support forum on the TED web page.
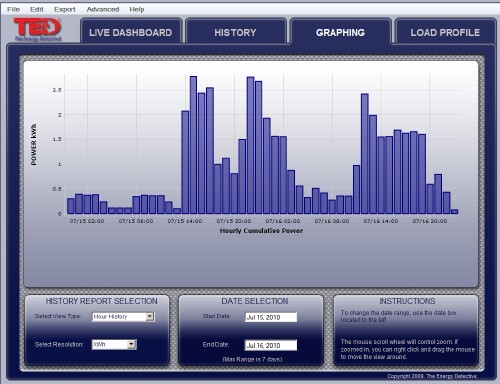
Here are some examples of the TED Dashboad (lhttp://ted5000/Footprints.html) and the hour graph:
 |
 This shows only the two heat pumps and the crawl-space dehumidifier. This shows only the two heat pumps and the crawl-space dehumidifier. |
Plots are available for seconds live history, minutes live history, hour history, day history and month history. The data can be downloaded to a csv file for manipulation in a spreadsheet; I recommend hours or longer downloads, unless you want a huge amount of data for seconds or minutes. Here is an example of the data for one month:
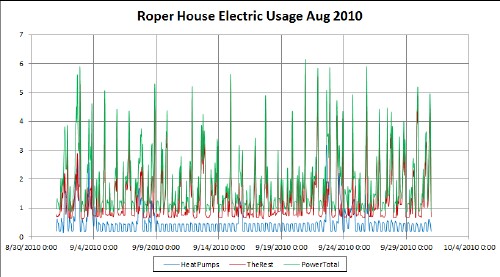
The small oscillations in the "heat pumps" data are due to a dehumidifier on the same circuit.
You can download 3rd-party software to see your electric usage in ways not provided by TED.
Another way to track a house's electic and gas energy usage is through earthaid.net:
L. David Roper, http://arts.bev.net/RoperLDavid/; roperld@vt.edu
L. David Roper interdisciplinary studies