L. David Roper
http://www.roperld.com/personal/roperldavid.htm
06-Apr-2016
Global Warming web pages by L. David Roper
It has become clear in recent years that solar insolation changing with time drives climate changes, accompanied by many feedback loops. Insolation can be accurately calculated versus latitude for times 10-million years in the past and 10-million years into the future (Berger 1991).
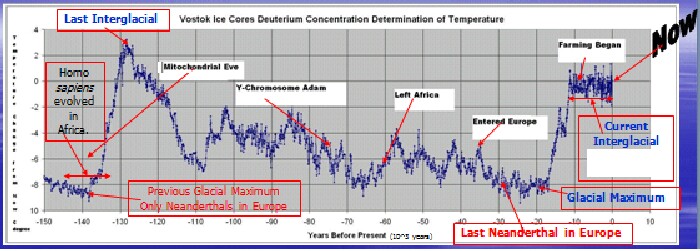
The Last Major Ice Age (last 130 kiloyears) (Petit, 1999) and the two Major Interglacials that bracket it are shown in the following graph with some seminal human events approximately indicated:
Y-chromosome Adam and humans leaving Africa may have been due to the extreme cold c70,000 ybp caused by the Toba volcanic supereruption (also see) as well as a low time for summer solar insolation at the North Pole (Berger 1991):
There was a human-population bottleneck at about that time.
It is instructive to view the summer insolation (watts/m2) versus latitude for some of the Antarctica maxima and minima (Berger 1991):
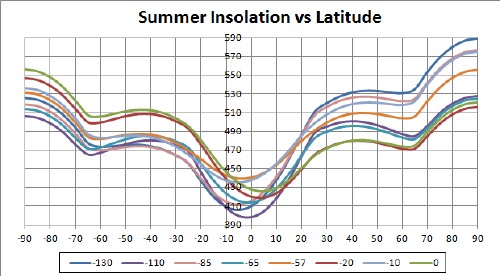
The times-of-year for this graph are: December for latitudes (-90,-20), June for latitudes (20,90), linearly changed from December to September for latitudes (-20,0) and linearly changed from June to September for latitudes (0,20).
The Antarctic temperature highs and lows used are:
Temperature High |
Temperature Low |
-130,000 |
-110,000 |
-85,000 |
-65,000 |
-57,000 |
-20,000 |
-10,000 |
Note that northern latitudes have higher insolation than southern latitudes for the temperature highs.
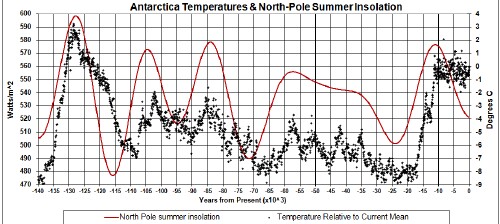
One can see why I used the summer insolation at the North Pole to compare to the Antarctica temperature, as that is the latitude that has the greatest difference between the temperature highs and lows:
Temperature High: North-Pole Insolation (watts/m2) |
Temperature Low: North-Pole Insolation (watts/m2) |
-130,000: 589 |
-110,000: 528 |
-85,000: 577 |
-65,000: 525 |
-57,000: 556 |
-20,000: 516 |
-10,000: 575 |
The North-Pole summer insolation is what melts Arctic ice.
I included the current time (0 = year 1990) in the graph to show that we would be into the next Major Ice Age if it were not for Neolithic Global Warming due to the advent of agriculture (Ruddiman, 2005) and Modern Global Warming due to the burning of fossil fuels.
It is instructive to view the summer insolation (watts/m2) versus latitude for future times up to 30,000 years from now:
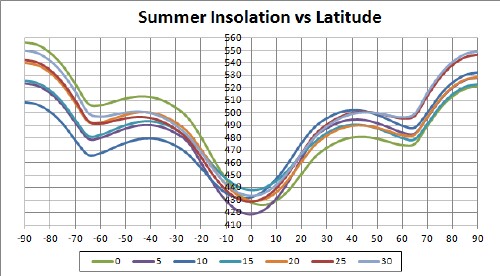
The times-of-year for this graph are: December for latitudes (-90,-20), June for latitudes (20,90), linearly changed from December to September for latitudes (-20,0) and linearly changed from September to June for latitudes (0,20).
Note that, if anthropogenic global warming had not occurred, the Earth would now be in the Next Major Ice Age, with perhaps a short reprieve in about 25,000 years.
Global Ice Mass Loss
Roper Global-Heating Web Pages
L. David Roper interdisciplinary studies
L. David Roper, http://www.roperld.com/personal/roperldavid.htm; roperld@vt.edu