Precipitation Patterns due to Global Heating
L. David Roper
http://www.roperld.com/personal/roperldavid.htmhttp://www.roperld.com/personal/roperldavid.htm
6 April, 2016
Contents
Introduction
Global Heating causes more moisture to be evaporated into the atmosphere from land and seas. Therefore, the average precipitation over the Earth increases as global heating increases.
Therefore, it is expected that land masses whose area is small compared to its boundary with seas should have the most increase in precipitation as global heating increases. And land masses whose area is large compared to its boundary with seas may decrease in precipitation as global heating increases.
These rules may not hold in every case; prevailing winds and the existence of mountain ranges may have large effects.
Precipitation data are taken from http://bonnet19.cs.qc.edu:7778/pls/rschdata/rd_start.main. Precipipation data for early times are sparse; so preference is given to data for later times. Usually there are many sites in a country for which data are available. The median is calculated for the twelve months of each year for a site. Sites are eliminated that are missing three months of data. Then, the median of all the sites is calculated for each year.
Yearly precipitation is plotted for the monthly median times 12. Another option would be to plot the monthly sums plus the monthly median times the number of missing months. It does not change the results very much to use this option.
I do not understand the unit of precipitation given (mm/year); that appears to be much too small a unit. I am considering the unit as arbitrary.
In the precipitation graphs that follow, a linear fit to the data and its equation are shown.
Countries studied: Australia, Brazil, Canada, Chad, Chile, China, Cuba, Czech Republic, Ireland, United Kingdom, United States, Mexico, India, New Zealand, Madagaskar, Mongolia, Iceland, Greenland, Russia (Europe), Japan, Italy, Spain, South Africa
Countries with Small Area Compared to Sea Boundary
First consider countries with small area compared to sea boundary. The following islands have increasing precipitation, as expected:
Mexico 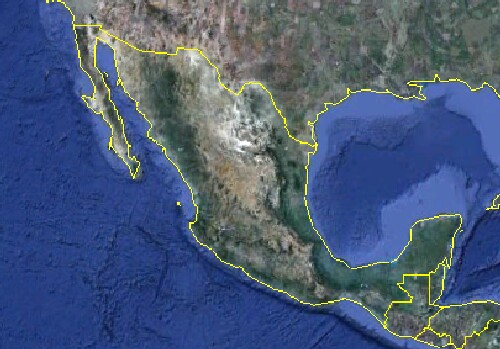 |
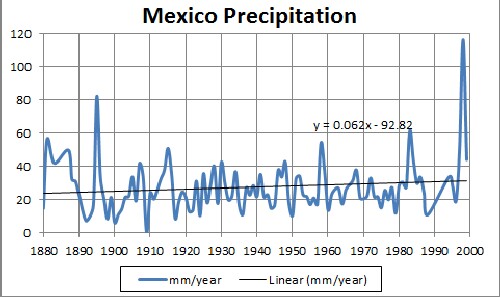 The rise in precipitation is as expected for global warming, because of ratio of shoreline to area. |
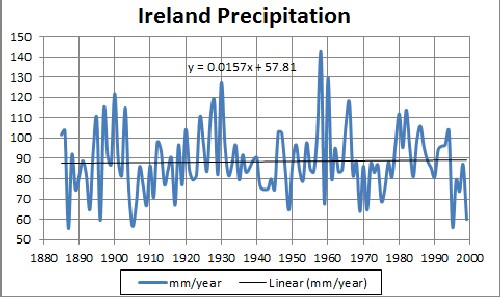
United Kingdom and Ireland
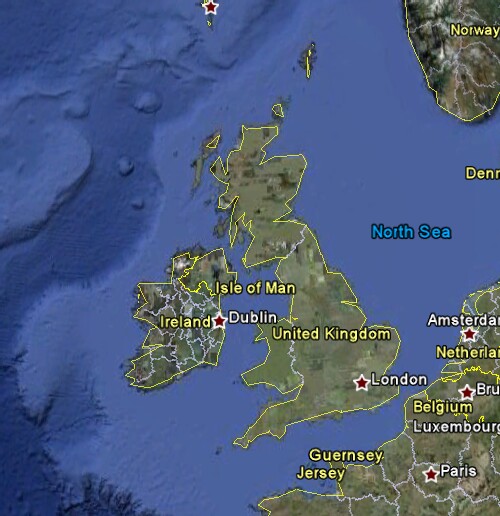 |
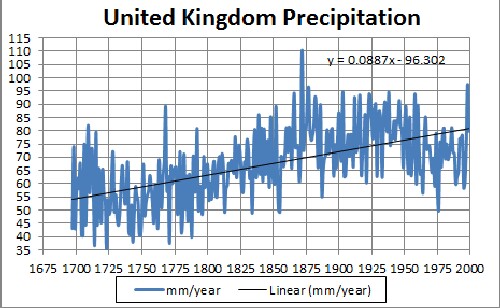 The rise in precipitation is as expected for global warming, because of ratio of shoreline to area. |
 It appears that the U.K. provides some shielding from North-Sea-caused precipitation |
Japan
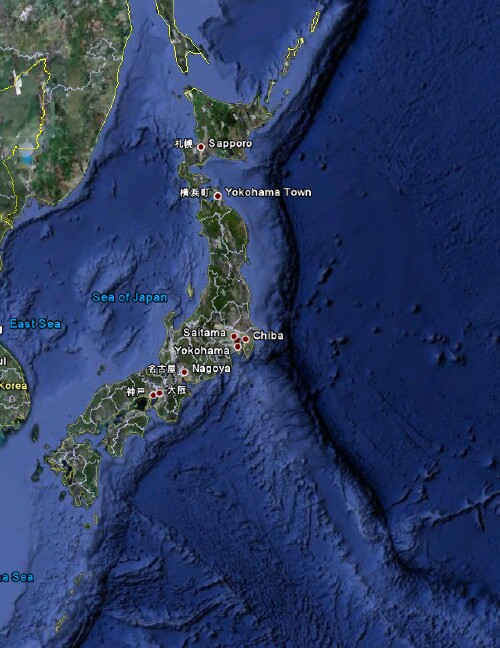 |
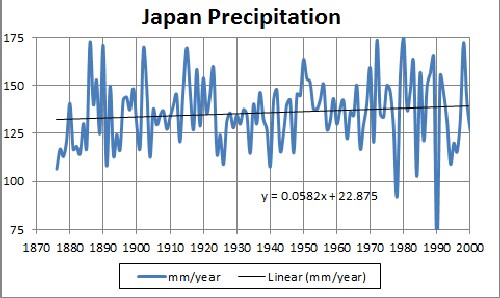 The rise in precipitation is as expected for global warming, because of ratio of shoreline to area. The rise in precipitation is as expected for global warming, because of ratio of shoreline to area.
|
New Zealand
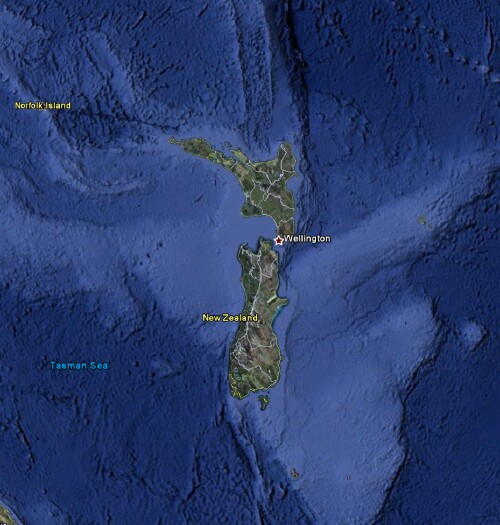 |
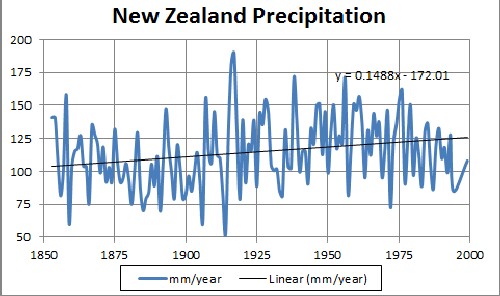 The rise in precipitation is as expected for global warming, because of ratio of shoreline to area. The rise in precipitation is as expected for global warming, because of ratio of shoreline to area.
|
Iceland
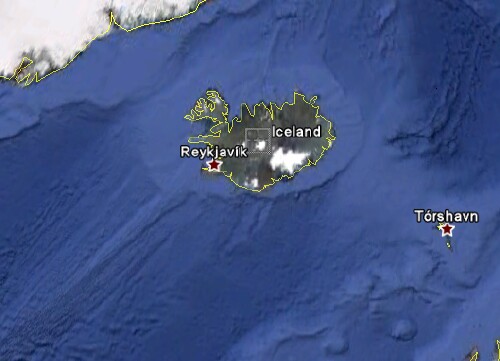 |
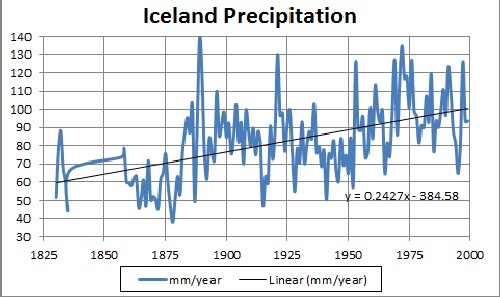 The rise in precipitation is as expected for global warming, because of ratio of shoreline to area. |
Greenland
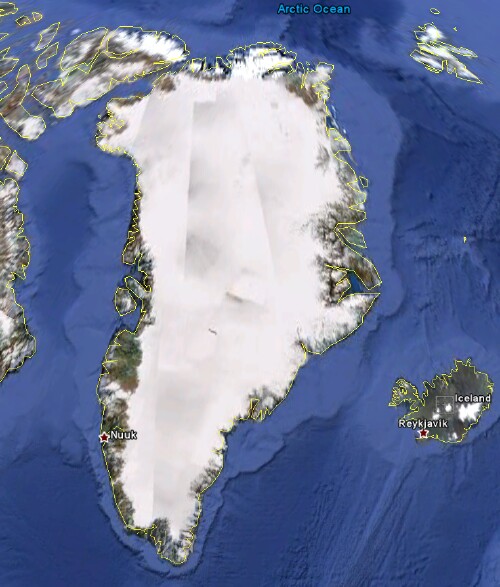 |
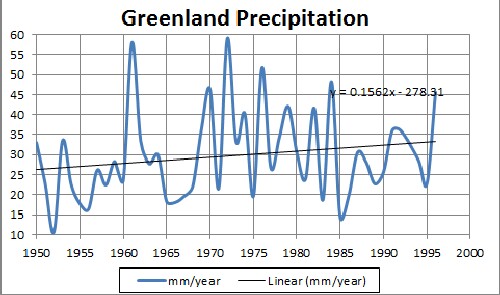 The rise in precipitation is as expected for global warming, because of ratio of shoreline to area. |
Go to the top.
The following islands have decreasing precipitation, apparently because the prevailing wind is off a large land mass to the west instead of the water to their east:
Cuba
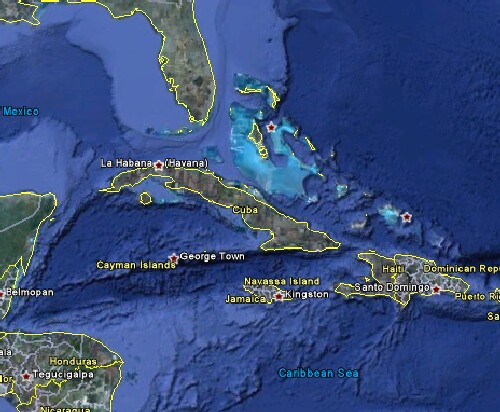 |
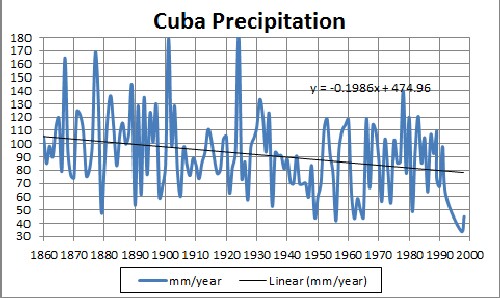 This appears to be an anomoly, as the ratio of shoreline to area should cause the precipitation to increase. Perhaps the North American and Central American land masses cause the precipitation to decrease. |
Madagaskar
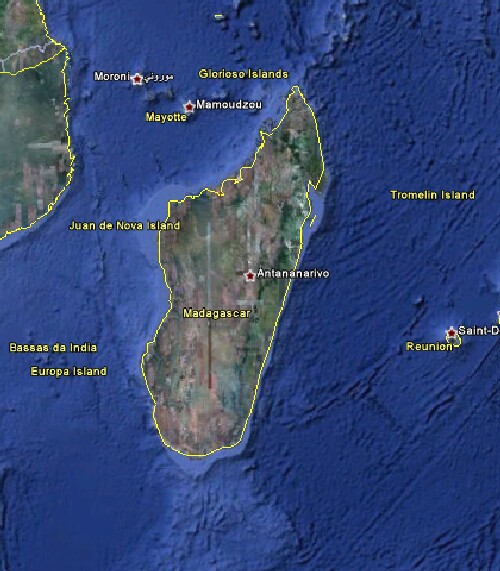 |
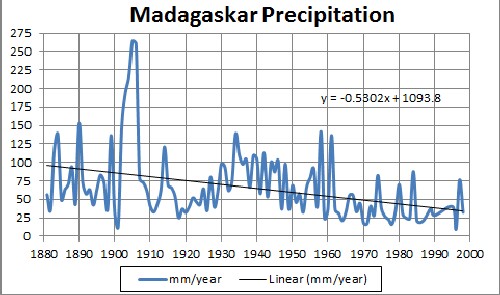 It appears that the African land mass causes the precipitation to decrease. |
Go to the top.
Countries with Large Area Compared to Sea Boundary
In general we expect these countries to have decreasing precipitation with time. The follow do:
United States
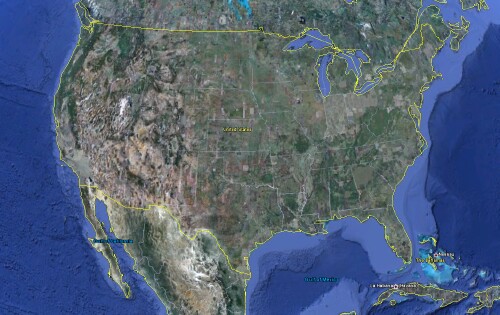 |
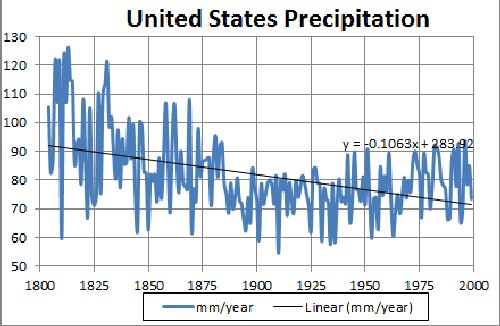 The large ratio of area to shoreline causes declining precipitation due to global warming. |
China
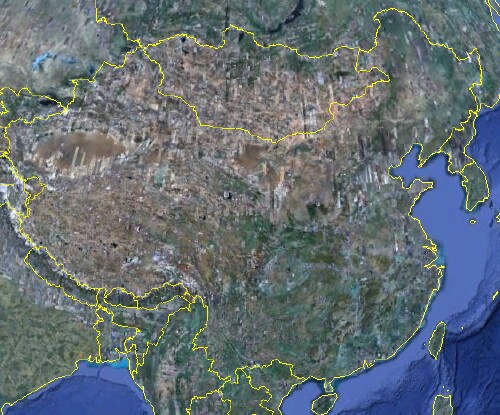 |
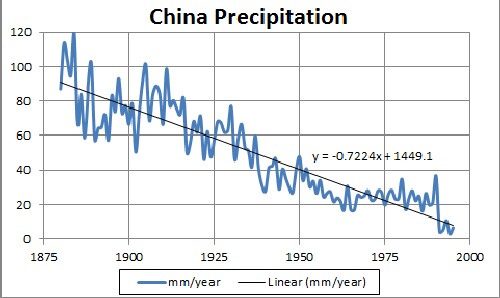
The large ratio of area to shoreline causes declining precipitation due to global warming. China is in dire straits with rapidly declining precipitation.
|
Brazil
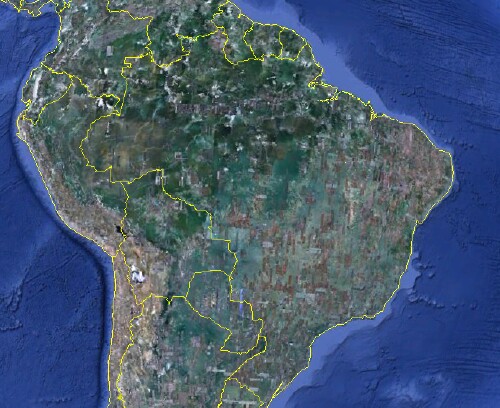 |
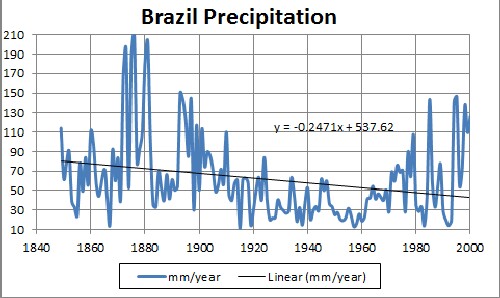 The large ratio of area to shoreline causes declining precipitation due to global warming. |
South Africa
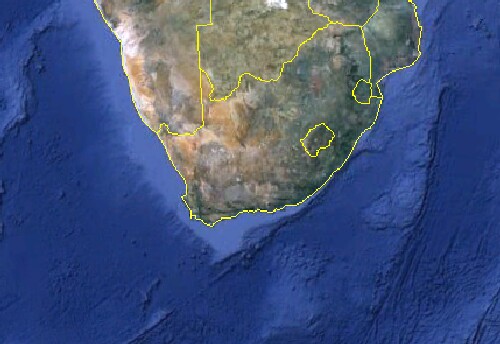 |
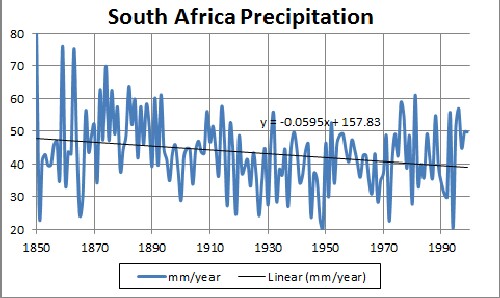 The large ratio of area to shoreline causes declining precipitation due to global warming. The large ratio of area to shoreline causes declining precipitation due to global warming.
|
Russia (Europe)
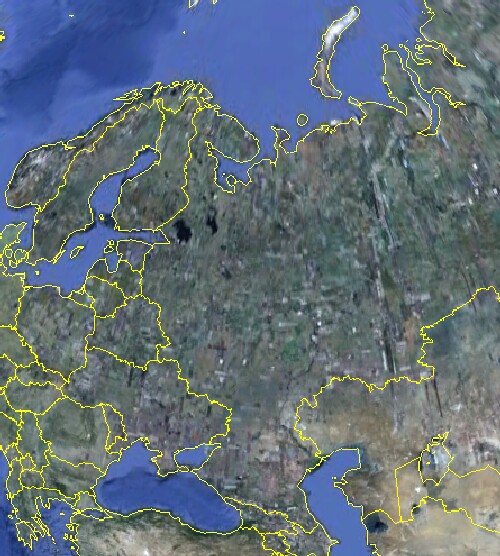 |
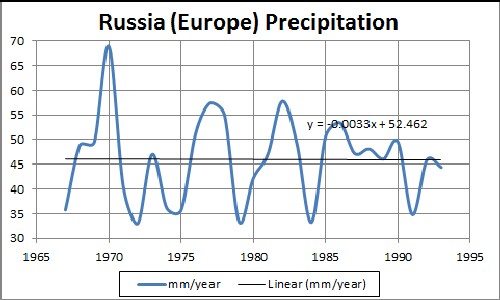 The large ratio of area to shoreline causes declining precipitation due to global warming. |
Go to the top.
Spain
 |
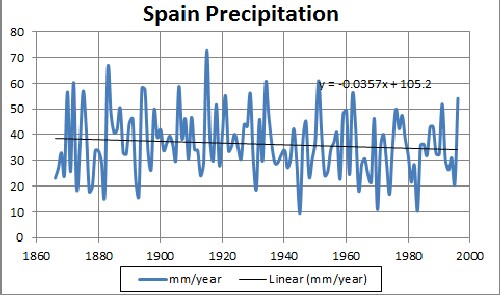 Despite the fact that Spain has water on the north, west and east, it has decreasing precipitation with time. I suspect that this has to do with prevailing winds from North Africa. |
Countries with Large Area and Large Shoreline
There are some large countries that have steady or increasing precipitation with time, mostly because of large bodies of water around them:
Canada
 |
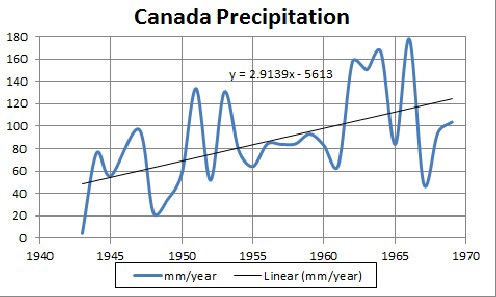 The ratio of area to shoreline is not large. |
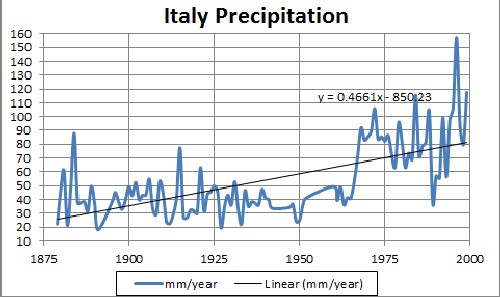
Italy
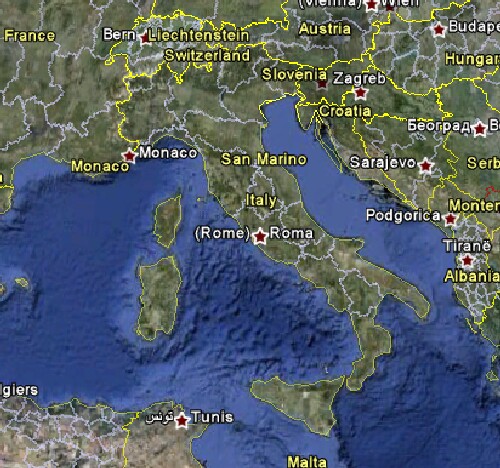 |
|
Chile 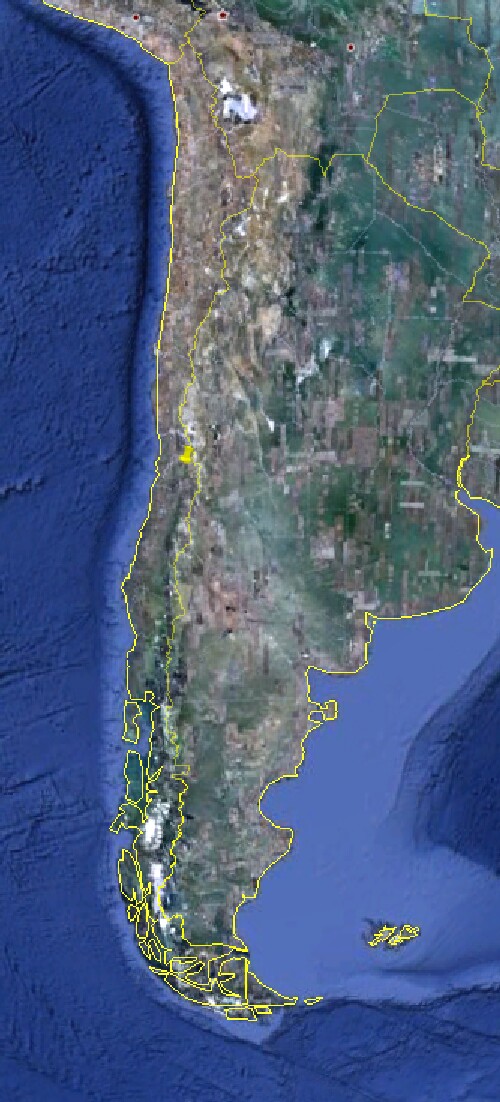 |
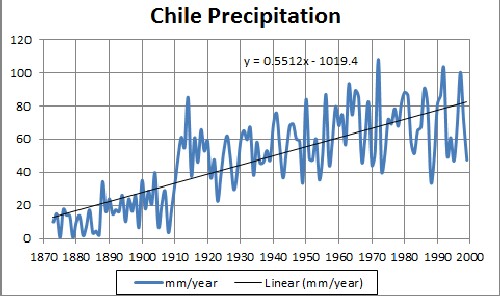 |
India
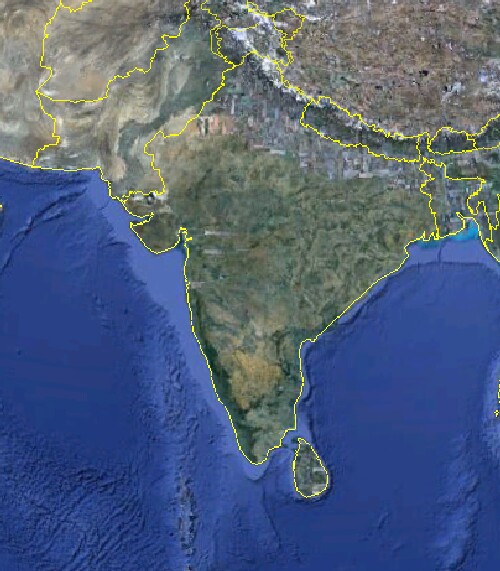 |
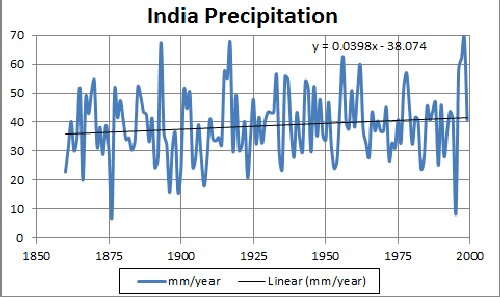 India's large land mass almost balances its water boundaries. |
Australia
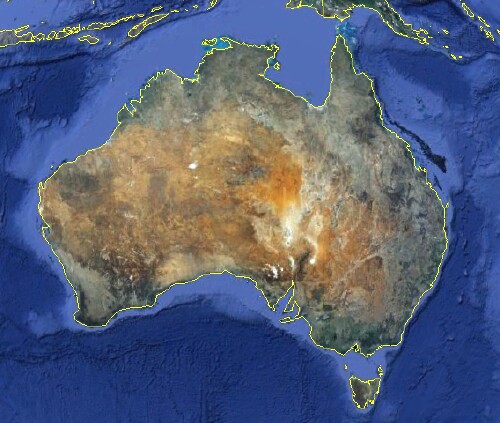 |
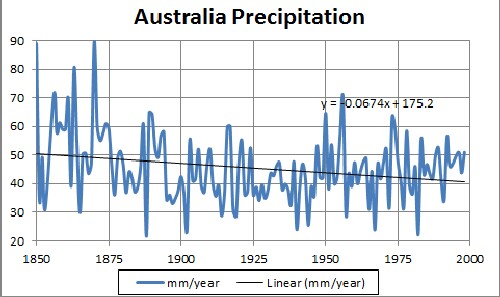 Australia is an exception. Perhaps the large Asian land mass to the north conteracts the water masses that surround Australia
|
Land-Bound Countries
Global heating, without extenuating circumstances, should cause precipitation to decrease for land-bound countries.
Chad
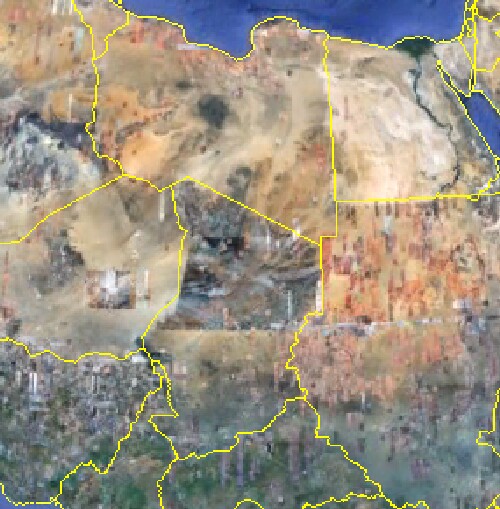 |
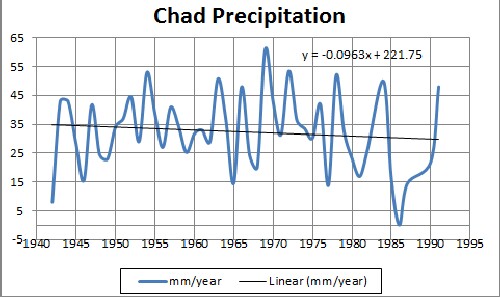 The data are rather poor. |
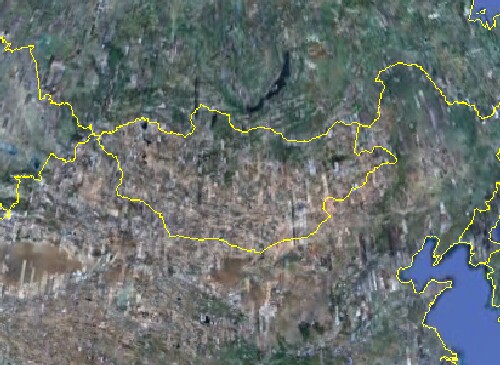
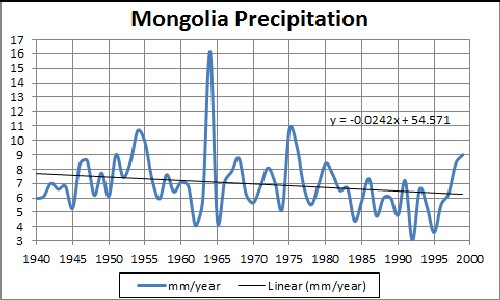
Mongolia
 |
 |
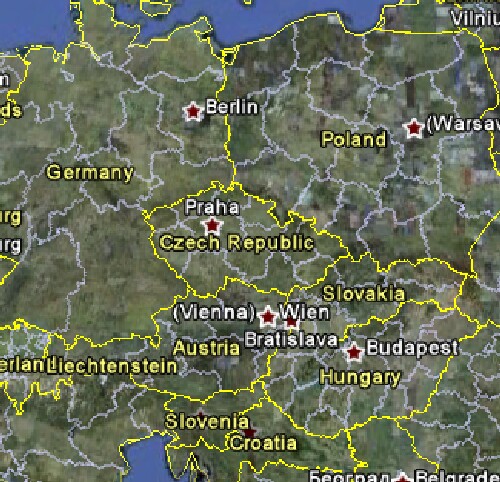
Czech Republic
 |
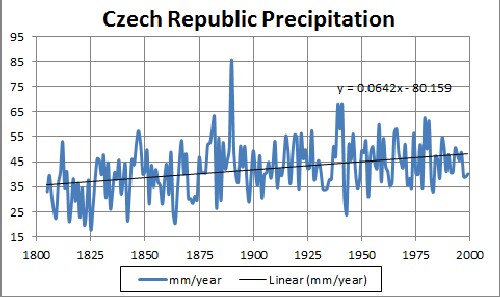 |
It appears that the global-heating effect was not operative until about 1950, and then only weakly.
|
Precipitation versus Land-Area/Coast-Length Ratio
This section is to test if the change in precipitation is a function the land/area to coast-length ratio. The following data for land areas were taken from Wikipedia.org and the coast lengths were roughly measured using the Microsoft Streets and Trips program:
Country |
Coast length (10^3 miles) |
Area (10^6 mi^2): |
Ratio (miles): |
Precip. Slope |
Cuba |
1.5 |
0.042 |
28.3 |
-0.1986 |
Iceland |
1.2 |
0.040 |
33.1 |
0.2427 |
Ireland |
0.85 |
0.033 |
38.3 |
0.0157
|
NZealand |
2.6 |
0.103 |
39.8 |
0.1488 |
Japan |
3.05 |
0.146 |
47.8 |
0.0582 |
UK |
1.95 |
0.094 |
48.2 |
0.08887 |
Spain |
1.84 |
0.195 |
106.2 |
0.0357 |
Greenland |
4.3 |
0.836 |
194.4 |
0.1562 |
Mexico |
3.7 |
0.762 |
205.8 |
0.062 |
SAfrica |
1.55 |
0.471 |
304.2 |
-0.0595 |
Australia |
8.15 |
2.941 |
360.9 |
-0.0674 |
India |
2.9 |
1.269 |
437.7 |
0.0398 |
USA |
5 |
3.131 |
626.2 |
-0.1063 |
Brazil |
4.1 |
3.288 |
801.9 |
-0.2471 |
China |
2.35 |
3.758 |
1599.1 |
-0.7224 |
|
|
|
|
|
Exclude: |
|
|
|
|
Canada |
4.6 |
3.854 |
837.8 |
2.9139 |
Italy |
2.05 |
0.116 |
56.8 |
0.4661 |
Chili |
3.1 |
0.292 |
94.3 |
0.5512 |
Madagaskar |
2.3 |
0.227 |
98.5 |
-0.5302 |
I have almost zero confidence in the Canada coast length that I measured, since their is so much inland water in northern Canada; therefore, I exclude Canada from the study.
The following graphs show the (precipitation slope for the linear fits to the precipitation versus time) versus (Area/Coast ratio in miles):
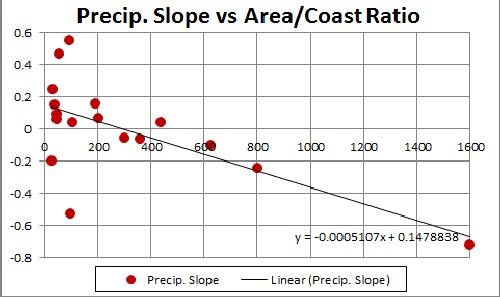
This shows that Italy, Chili and Madagaskar are outliers, probably because they are narrow pieces of land. So I exclude them in the next graph.
|
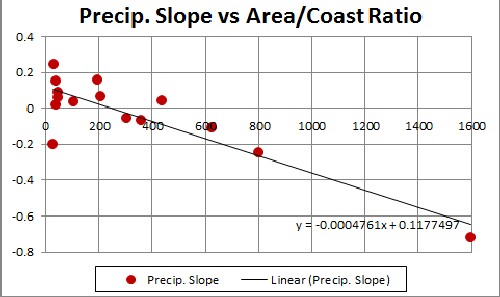
Both graphs have about the same linear slope. The linear fit is quite good.
|
Conclusion
The data shown above fit the theory of increased evaporation and, thus, precipitation due to global heating.
Although, for example, precipitation has decreased for the United States, it probably increased along the coasts. Therefore, it probably decreased even more in the central part, the "breadbasket".
China is in dire straits with rapidly declining precipitation.
References
Go to the top.
Roper Global-Heating Web Pages
L. David Roper interdisciplinary studies