Beryllium extraction rate for the world and a Verhulst functions fit to the data.
L. David Roper
http://www.roperld.com/personal/RoperLDavid.htm
2 July, 2016
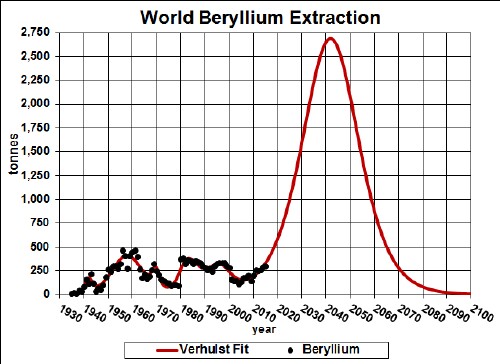
Beryllium is used in a wide variety of materials, especially as a hardening agent in alloys. The graph below shows the beryllium extraction data for the world and a Verhulst function fits to the data in order to extrapolate into the future.
Beryllium extraction rate for the world and a Verhulst functions fit to the data.
The red curve is obtained by doing a best fit of several Verhulst functions to the the extraction data.
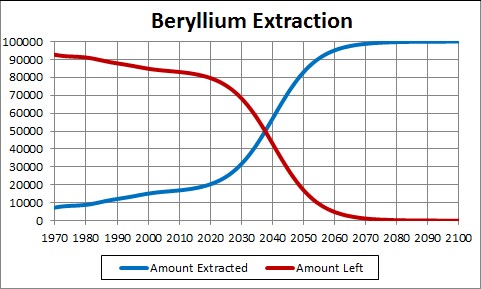
World reserves/resources are very uncertain.
The crossover point at year ~2039 when the amount extracted is equal to the amount left to be extracted is shown here:
Assume that:
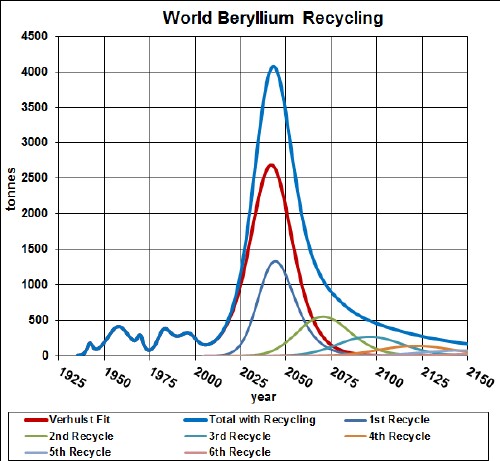
The effective beryllium available for making items after the first ten recycling cycles is shown in the following graph, along with the effective beryllium available for each cycle:
The equation for a recyling cycle is
where Ei is the amount available from the previous cycle. Here is an example of the Excel coding:
{=(($J$2+$I$2)/2+(($J$2-$I$2)/2)*TANH((A27-$K$2)/$L$2))*SUM($I$27:I27*(EXP(-1*((A27-$A$27:A27-$N$2)/$O$2)^2/2))/$O$2/SQRT(2*PI()))} (The curly bracket surrounding the term makes it into an array; it must be entered by holding down the SHIFT & CTRL keys while pressing the ENTER key.)
Thus, under the assumptions given above, the effective amount of beryllium available for making items peaked at about year 1975 and falls off rapidly after that. Humans will have taken concentrated beryllium deposits and scattered them across the surface of the earth.
The Excel spreadsheet is set up to make it easy to calculate with different recycling assumptions.