L. David Roper
http://arts.bev.net/RoperLDavid/
05-Nov-2016
The purpose of this article is to analyze the extraction data for oil and gas in the Gulf of Mexico (GOM) to try to project into the future.
Oil extraction began in the Gulf of Mexico in 1953. It rose at an exponential time constant of ~3.3 years until the late 1960s. Then it oscillated with major peaks at ~1971, ~1985, ~2002 and ~2009. Currently, in 2016, it is on the rise again.
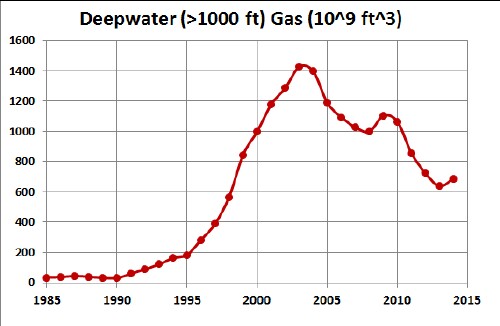
Gas extraction began in the Gulf of Mexico in 1953. It rose at an exponential time constant of ~3.5 years until the early 1970s. Then it oscillated with major peaks at ~1981, ~1990 and~1997. After 2001 is has been declining at an exponential time constant of ~8.4 years. Currently, in 2016, it is on the leveled off for the last two years.
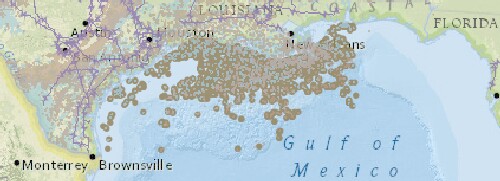
Here is a map of the oil and gas rigs in the GOM:
The extraction data for oil and gas in the GOM is available from Bureau of Ocean Energy Management. Listed are values for Oil, Condensate, Total Oil, Gas, Casinghead and Total Gas. Used in this study are Total Oil and Total Gas, but also look at the ratios condensate/oil and casinghead/gas. Deepwater (>1000 ft water) GOM data are available.
The amount extracted in the GOM through year 2015 = ~19.58 x 10⁹ barrels.
Useful for projecting into the future are:
Here these values are assumed optimistically to be valid for 2015.
For a third calculation consider a Super Optimistic Resources in 2015: 31.7 x 10⁹ barrels of oil; 119.4 x 1012 ft3 of gas, just to see what huge numbers would do.
The depletion function that is used in this article is the Verhulst function:
The asymmetry parameter, n, must be greater than 0.
where 
The maximum of P(t) occurs at ![]() , which yields the peak value
, which yields the peak value ![]() .
.
For the symmetric case (n=1): ![]() and
and ![]() .
.
For a depletion situation for which there are N peaks the depletion function is:
 .
.
When a peak is symmetrical, the Verhulst function simplifies to
The fits are done using a sum of several Verhulst functions assuming the final peak is symmetric. Probably it will be antisymmetric skewed toward the future; i.e., the Verhulst parameter n will be >1, which would make the peak occur earlier and sooner.
This graph shows the GOM oil-extraction data and two fits to the data using the reserves (red) and the resources (blue) given above:
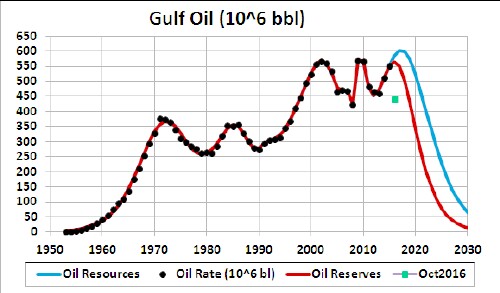
This fit uses 7 Verhulst functions.
The green square is a projected value for 2016 GOM oil extraction from the data available through October 2016 which was not used in the fit. It appears to be anomalously low.
If one assumes the Super Optimistic Resources given above, the fit to the data is:
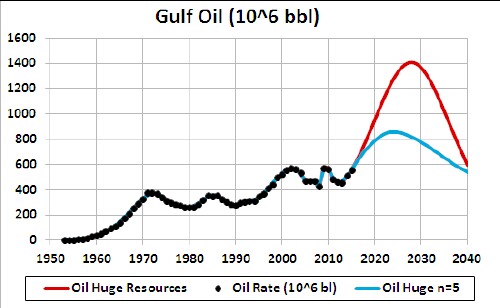
The red curve has a final symmetric peak (n=1) and the blue curve has a peak skewed toward the future (n=5).
An even larger value for n would reduce the peak size and year further.
For such a huge, probably unrealistic, resources, there could be more than one future peak.
It is interesting to calculate the yearly ratio condensate/oil:
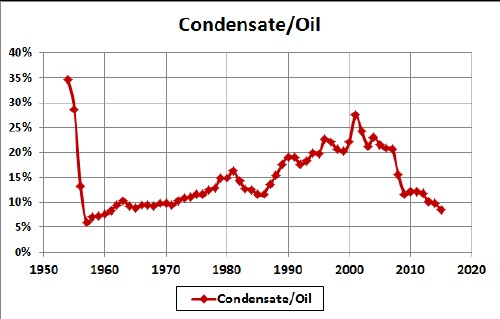
When total gas peaked at year 2001 (see below), the condensate/oil ratio also peaked.
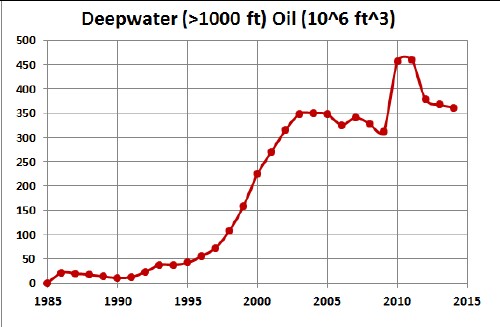
Define "deepwater" as extraction in >1000 ft of water:


A fit to the GOM gas-extraction data is:
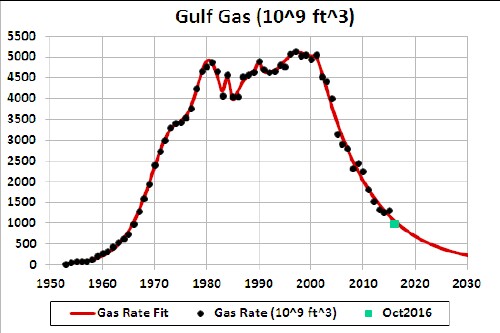
This fit uses 7 Verhulst functions.
The green square is a projected value for 2016 GOM oil extraction from the data available through October 2016 which was not used in the fit.
The calculated reserves value for this fit is 11.0 x 1012 ft3, lower that the reserve (13.3 x 1012 ft3) and the resources value (13.3 x 1012 ft3) given above. Since the 2016 projected value is nearly on the red fit curve, no attempt is made to add a future peak to yield the two larger given reserves and resources values.
It is interesting to calculate the yearly ratio casinghead/gas:
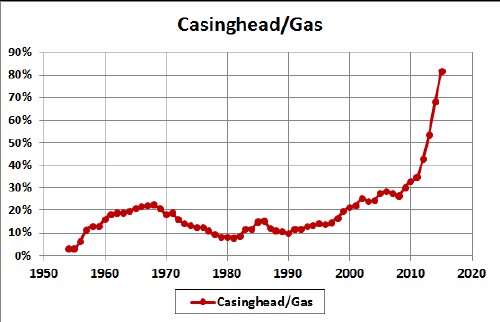
After the peak of total gas at year 2001, the casinghead/oil ratio started increasing. Then most of the total gas was casinghead after year 2012.
Define "deepwater" as extraction in >1000 ft of water: