(Back to
Politics)
(Back to Economy and Political
Parties)
(Back to U.S. Federal Debt and Political
Parties)
Since the Franklin Roosevelt administration there have been 25 years with Democratic presidents and 31 with Republican presidents. I have studied the United States government debt data for all of those administrations and have found the following:
There are good arguments that the ratio of debt to Gross Domestic Product (GDP) is the parameter that should be studied.
One possibility should allow for a time lag of unemployment relative to the tenure of an administration, as it may take a while for an administration to put its economic policies in place.
The average yearly change in Debt/GDP (in %) was
There might be some interest in comparing the recent Clinton administration (1993-2000) with the current BushGW administration (2001-2003) and the previous Reagan/BushGHW (1981-92) administration.
The average yearly change in Debt/GDP (in %) was
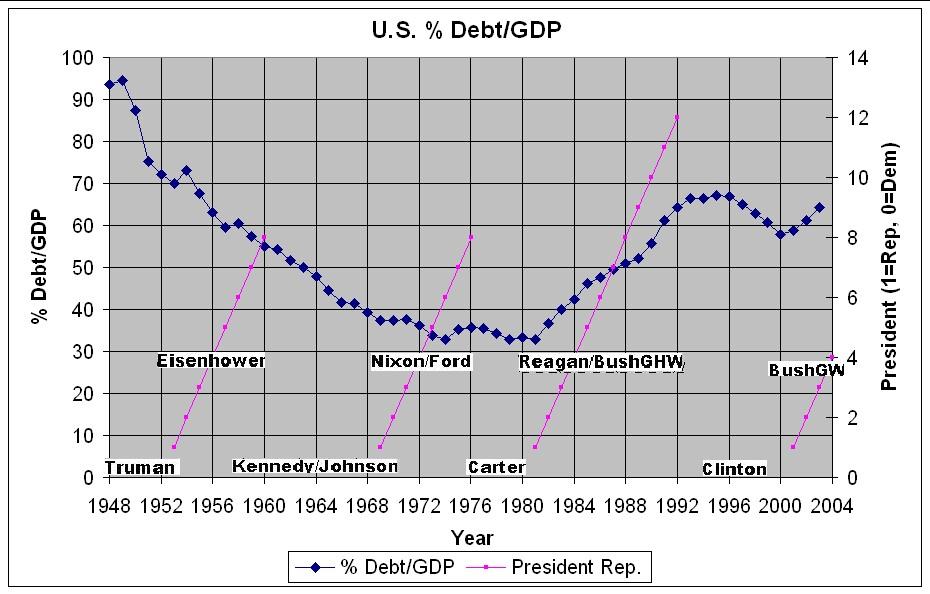
| The following graph shows the Debt/GDP (in %) data and the presidential administrations for the last 56 years. |
|
| There apparently was a big change in Republican economic policy between Eisenhower and Reagan. |
Some may argue that it makes a big difference which party controls the Congress as to whether a presidential administration can decrease the federal debt. A quick study of the record for the last fifty-six years shows that Republican administrations did a better job of reducing federal debt when the Congress was controlled by Democrats, but it did not make much difference which party controlled the Congress with Democratic administrations.
I would welcome anyone to analyze the United States federal-debt data with regard to the performance of presidential administrations for the last fifty-six years, if they think that the above is not correct, and inform me of any errors I might have made.
I leave it up to the reader to make any inferences from the analysis above about which party they should vote for in the upcoming presidential and congressional election.
I have combined GDP and Debt by GDP - Debt change and plotted them against presidencies and party control of Congress:
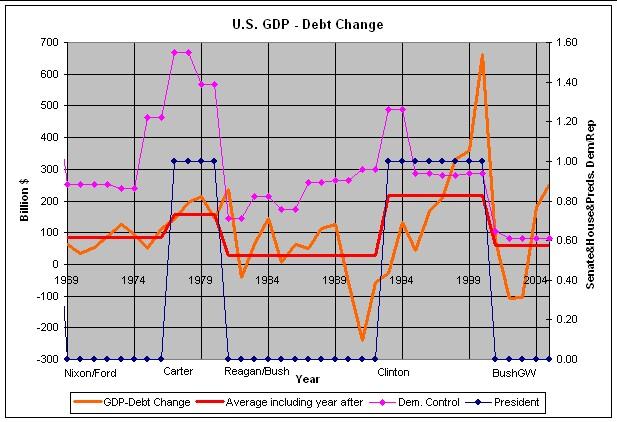
It is very clear that the GDP - Debt change was higher during the Carter and Clinton Democratic administrations than it was during the Nixon/Ford, Reagan/Bush and BushGW Republican administrations. Note that the only times with the difference was negative was during the Reagan/Bush (once for each) and the BushGW Republican administrations.
The data used are in the table below:
|
Dem. Control
|
Year
|
DGP-Debt
|
DGP-Debt Change
|
Average including year after
|
|
|
0.44
|
1929 |
Hoover |
86.769 |
||
|
0.44
|
1930 |
Hoover |
75.115 |
-11.654 |
|
|
0.66
|
1931 |
Hoover |
59.799 |
-15.316 |
|
|
0.66
|
1932 |
Hoover |
39.313 |
-20.486 |
|
|
1.77
|
1933 |
RooseveltF |
33.861 |
-5.452 |
|
|
1.77
|
1934 |
RooseveltF |
38.947 |
5.086 |
|
|
2.30
|
1935 |
RooseveltF |
44.599 |
5.652 |
|
|
2.30
|
1936 |
RooseveltF |
49.921 |
5.322 |
|
|
3.05
|
1937 |
RooseveltF |
55.475 |
5.554 |
|
|
3.05
|
1938 |
RooseveltF |
48.935 |
-6.54 |
|
|
1.85
|
1939 |
RooseveltF |
51.56 |
2.625 |
|
|
1.85
|
1940 |
RooseveltF |
58.332 |
6.772 |
|
|
1.67
|
1941 |
RooseveltF |
77.739 |
19.407 |
|
|
1.67
|
1942 |
RooseveltF |
89.378 |
11.639 |
|
|
1.19
|
1943 |
RooseveltF |
61.431 |
-27.947 |
|
|
1.19
|
1944 |
RooseveltF |
18.697 |
-42.734 |
|
|
1.26
|
1945 |
RooseveltF/Truman |
-35.682 |
-54.379 |
|
|
1.26
|
1946 |
Truman |
-47.122 |
-11.44 |
|
|
0.88
|
1947 |
Truman |
-13.886 |
33.236 |
|
|
0.88
|
1948 |
Truman |
17.308 |
31.194 |
|
|
1.27
|
1949 |
Truman |
14.93 |
-2.378 |
|
|
1.27
|
1950 |
Truman |
36.943 |
22.013 |
|
|
1.07
|
1951 |
Truman |
84.278 |
47.335 |
|
|
1.07
|
1952 |
Truman |
99.495 |
15.217 |
|
|
0.64
|
1953 |
Eisenhower |
113.829 |
14.334 |
|
|
0.64
|
1954 |
Eisenhower |
102.35 |
-11.479 |
|
|
0.72
|
1955 |
Eisenhower |
134.431 |
32.081 |
|
|
0.72
|
1956 |
Eisenhower |
161.372 |
26.941 |
|
|
0.74
|
1957 |
Eisenhower |
186.602 |
25.23 |
|
|
0.74
|
1958 |
Eisenhower |
184.978 |
-1.624 |
|
|
1.24
|
1959 |
Eisenhower |
216.422 |
31.444 |
|
|
1.24
|
1960 |
Eisenhower |
237.183 |
20.761 |
|
|
1.42
|
1961 |
Kennedy |
249.531 |
12.348 |
|
|
1.42
|
1962 |
Kennedy/Johnson |
283.03 |
33.499 |
|
|
1.50
|
1963 |
Johnson |
309.353 |
26.323 |
|
|
1.50
|
1964 |
Johnson |
346.46 |
37.107 |
|
|
1.74
|
1965 |
Johnson |
399.196 |
52.736 |
|
|
1.74
|
1966 |
Johnson |
459.981 |
60.785 |
|
|
1.37
|
1967 |
Johnson |
489.437 |
29.456 |
|
|
1.37
|
1968 |
Johnson |
553.471 |
64.034 |
|
|
0.88
|
1969 |
Nixon |
617.074 |
63.603 |
84.33178 |
|
0.88
|
1970 |
Nixon |
650.542 |
33.468 |
84.33178 |
|
0.88
|
1971 |
Nixon |
704.469 |
53.927 |
84.33178 |
|
0.88
|
1972 |
Nixon |
791.102 |
86.633 |
84.33178 |
|
0.86
|
1973 |
Nixon |
915.511 |
124.409 |
84.33178 |
|
0.86
|
1974 |
Nixon/Ford |
1008.335 |
92.824 |
84.33178 |
|
1.22
|
1975 |
Ford |
1058.551 |
50.216 |
84.33178 |
|
1.22
|
1976 |
Ford |
1170.356 |
111.805 |
84.33178 |
|
1.55
|
1977 |
Carter |
1312.457 |
142.101 |
156.3194 |
|
1.55
|
1978 |
Carter |
1506.693 |
194.236 |
156.3194 |
|
1.39
|
1979 |
Carter |
1721.284 |
214.591 |
156.3194 |
|
1.39
|
1980 |
Carter |
1865.39 |
144.106 |
156.3194 |
|
0.71
|
1981 |
Reagan |
2102.571 |
237.181 |
29.27085 |
|
0.71
|
1982 |
Reagan |
2062.127 |
-40.444 |
29.27085 |
|
0.82
|
1983 |
Reagan |
2124.198 |
62.071 |
29.27085 |
|
0.82
|
1984 |
Reagan |
2269.734 |
145.536 |
29.27085 |
|
0.76
|
1985 |
Reagan |
2274.308 |
4.574 |
29.27085 |
|
0.76
|
1986 |
Reagan |
2337.522 |
63.214 |
29.27085 |
|
0.89
|
1987 |
Reagan |
2389.198 |
51.676 |
29.27085 |
|
0.89
|
1988 |
Reagan |
2501.412 |
112.214 |
29.27085 |
|
0.90
|
1989 |
BushGHW |
2626.919 |
125.507 |
29.27085 |
|
0.90
|
1990 |
BushGHW |
2569.762 |
-57.157 |
29.27085 |
|
0.96
|
1991 |
BushGHW |
2330.622 |
-239.14 |
29.27085 |
|
0.96
|
1992 |
BushGHW |
2273.129 |
-57.493 |
29.27085 |
|
1.26
|
1993 |
Clinton |
2245.911 |
-27.218 |
217.3592 |
|
1.26
|
1994 |
Clinton |
2379.475 |
133.564 |
217.3592 |
|
0.94
|
1995 |
Clinton |
2423.667 |
44.192 |
217.3592 |
|
0.94
|
1996 |
Clinton |
2592.014 |
168.347 |
217.3592 |
|
0.93
|
1997 |
Clinton |
2801.937 |
209.923 |
217.3592 |
|
0.93
|
1998 |
Clinton |
3132.758 |
330.821 |
217.3592 |
|
0.94
|
1999 |
Clinton |
3492.334 |
359.576 |
217.3592 |
|
0.94
|
2000 |
Clinton |
4154.759 |
662.425 |
217.3592 |
|
0.65
|
2001 |
BushGW |
4229.362 |
74.603 |
59.0644 |
|
0.61
|
2002 |
BushGW |
4121.413 |
-107.949 |
59.0644 |
|
0.61
|
2003 |
BushGW |
4018.107 |
-103.306 |
59.0644 |
|
0.61
|
2004 |
BushGW |
4198.355 |
180.248 |
59.0644 |
|
0.61
|
2005 |
BushGW |
4450.081 |
251.726 |
59.0644 |