(Back to
Politics)
(Back to United States Health and
Political Parties)
(Go to data table at
bottom.)
The infant mortality rate (number of deaths in first year of life per 1000 live births) varies greatly among the states in the United States. (See table at end for 1996-8 rates.)
An interesting question to ask is: Is there any correlation between the infant mortality rate and the strength of the two political parties in the states? At first thought of this question, I reasoned that the proclivity of the Republican party to not concern government about such matters might be balanced or overcome by the tendency of African Americans to vote Democratic, since the infant mortality rate for them is much higher than for others. I was surprised to get the results of such a study that are shown below.
I compared different state's infant-mortality-rate (IMR) data with the results of the 1996 presidential election for each state. (See table at end for votes in the 1996 election.) A correlation calculation yielded the following:
| Correlation | Rate |
| Democrat vote | -0.140 |
| Republican vote | +0.364 |
That is, the Democratic votes for the states had a 14% negative correlation with increasing IMR and the Republican votes had a 36% positive correlation. States with high infant mortality rate vote much more Republican than Democratic and vice versa.
|
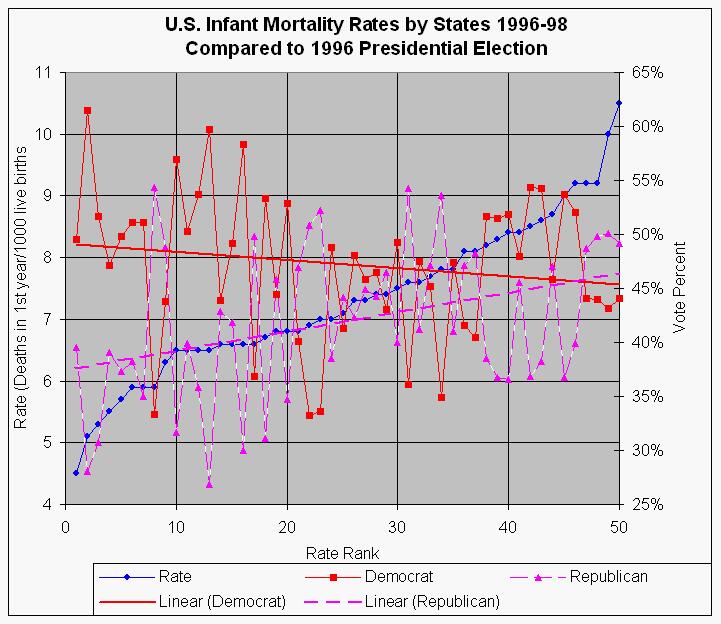
| This is a plot of the infant mortality rate (IMR)sorted by rank of the states compared to the Democratic votes and the Republican votes. (See table at end for the data.) Also shown are linear fits to the two votes. This shows visually the positive correlation of IMR with the Republican vote and the negative correlation of IMR with the Democratic vote. Note that the four highest IMR states are definitely Republican and the seven lowest IMR states are definitely Democratic. |
What can one conclude from these results? Whatever factors cause the large disparity for infant mortality rates between the various states also cause those states to tend to vote Republican. I believe that the main factors are:
My Republican native state, Oklahoma (rate=8.1), ranked 37 of 50 and my Republican adopted state, Virginia (rate=7.7), ranked 33 of 50 for increasing infant mortality rate in 1996-8.
The United States ranked 26th among 38 selected countries in infant mortality rate in 1996, with a rate of 7.3, just behind Portugal and before Cuba and almost twice as high as the number 1 ranked country Singapore, with a rate of 3.8. In 2001 (http://www.bartleby.com/151/a28.html) the United States ranked 40th among 223 countries, with a rate of 6.76, asmost twice as high as the number 1 ranked country Sweden, with a rate of 3.47.
| Infant Mortality Rates (IMR) 1996-8 | 1996 election | |||
| State | Rate | Democrat | Republican | IMR Rank |
| New Hampshire | 4.5 | 49.6% | 39.6% | 1 |
| Massachusetts | 5.1 | 61.5% | 28.1% | 2 |
| Maine | 5.3 | 51.6% | 30.8% | 3 |
| Oregon | 5.5 | 47.2% | 39.1% | 4 |
| Washington | 5.7 | 49.8% | 37.3% | 5 |
| California | 5.9 | 51.1% | 38.2% | 6 |
| Minnesota | 5.9 | 51.1% | 35.0% | 7 |
| Utah | 5.9 | 33.3% | 54.4% | 8 |
| Texas | 6.3 | 43.8% | 48.8% | 9 |
| Hawaii | 6.5 | 56.9% | 31.6% | 10 |
| Iowa | 6.5 | 50.3% | 39.9% | 11 |
| New Jersey | 6.5 | 53.7% | 35.9% | 12 |
| Rhode Island | 6.5 | 59.7% | 26.8% | 13 |
| Nevada | 6.6 | 43.9% | 42.9% | 14 |
| New Mexico | 6.6 | 49.2% | 41.9% | 15 |
| New York | 6.6 | 58.3% | 30.0% | 16 |
| Wyoming | 6.6 | 36.8% | 49.8% | 17 |
| Vermont | 6.7 | 53.4% | 31.1% | 18 |
| Colorado | 6.8 | 44.4% | 45.8% | 19 |
| Connecticut | 6.8 | 52.8% | 34.7% | 20 |
| North Dakota | 6.8 | 40.1% | 46.9% | 21 |
| Alaska | 6.9 | 33.3% | 50.8% | 22 |
| Idaho | 7 | 33.6% | 52.2% | 23 |
| Wisconsin | 7 | 48.8% | 38.5% | 24 |
| Montana | 7.1 | 41.3% | 44.1% | 25 |
| Florida | 7.3 | 48.0% | 42.3% | 26 |
| Kentucky | 7.3 | 45.8% | 44.9% | 27 |
| Arizona | 7.4 | 46.5% | 44.3% | 28 |
| South Dakota | 7.4 | 43.0% | 46.5% | 29 |
| Pennsylvania | 7.5 | 49.2% | 40.0% | 30 |
| Kansas | 7.6 | 36.1% | 54.3% | 31 |
| Missouri | 7.6 | 47.5% | 41.2% | 32 |
| Virginia | 7.7 | 45.1% | 47.1% | 33 |
| Nebraska | 7.8 | 35.0% | 53.7% | 34 |
| Ohio | 7.8 | 47.4% | 41.0% | 35 |
| Indiana | 8.1 | 41.6% | 47.1% | 36 |
| Oklahoma | 8.1 | 40.4% | 48.3% | 37 |
| Michigan | 8.2 | 51.7% | 38.5% | 38 |
| West Virginia | 8.3 | 51.5% | 36.8% | 39 |
| Delaware | 8.4 | 51.8% | 36.6% | 40 |
| Tennessee | 8.4 | 48.0% | 45.6% | 41 |
| Illinois | 8.5 | 54.3% | 36.8% | 42 |
| Maryland | 8.6 | 54.3% | 38.3% | 43 |
| Georgia | 8.7 | 45.8% | 47.0% | 44 |
| Arkansas | 9 | 53.7% | 36.8% | 45 |
| Louisiana | 9.2 | 52.0% | 39.9% | 46 |
| North Carolina | 9.2 | 44.0% | 48.7% | 47 |
| South Carolina | 9.2 | 44.0% | 49.8% | 48 |
| Alabama | 10 | 43.2% | 50.1% | 49 |
| Mississippi | 10.5 | 44.1% | 49.2% | 50 |
(Back to top of data
table)
(Back to the top of Infant Mortality and Political
Parties)
(Back to United States Health and
Political Parties)
(Back to
Politics)