
(Back to
Politics)
(Back to Economy and Political
Parties)
(Back to United States Well-Being and
Political Parties)
(Go to data table at
bottom.)
In another location I have calculated the correlations of political-party voting in the 1996 U.S. presidential with several well-being factors. In the process each state was ranked for each well-being factor. Since I live in the state of Virginia, I include here a graph showing Virginia's rankings for the several factors:
|
| For the definitions of the factors, see http://arts.bev.net/roperldavid/politics/USHealth.htm. I think that most people would regard all of the factors except the highest two as negative and the highest two as positive. Virginia weak points (in increasing severity) are suicides, cancer deaths, cardiovascular deaths, homicides/police interventions deaths, gun deaths, infant mortality, number of prisoners per capita and toxins released per area, while her strong points (in increasing severity) are auto deaths, child abuse, property crime, cirrhosis (alcohol) deaths, violent crime, occupational deaths, poverty rate, and medical uninsured. |
Virginia fared better than most other Republican states, as the following graph shows:
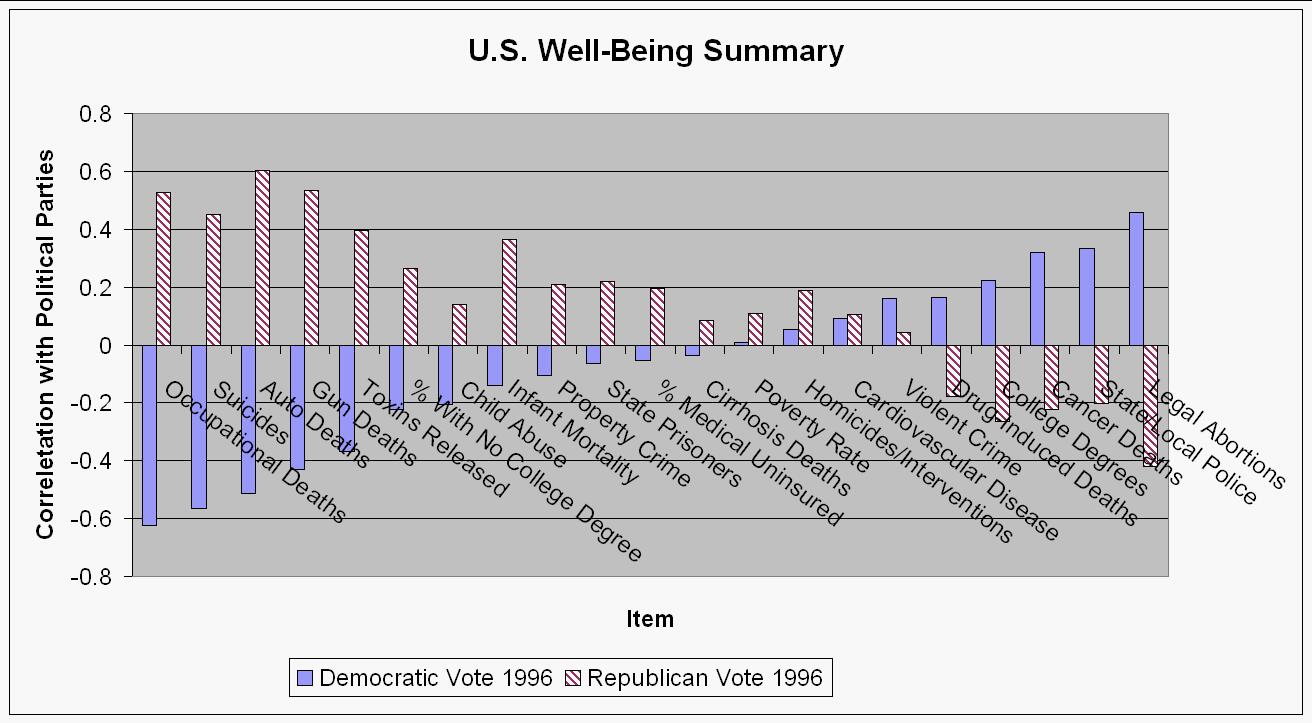 |
| For the definitions of the factors, see http://arts.bev.net/roperldavid/politics/USHealth.htm. I think that most people would regard all of the factors negative, except number of police per capita and number per capita with college degrees. Note how the correlations with the Democratic vote are mostly negative for the negative factors, while the correlations with the Republican vote are generally positive for the negative factors. For the two positive factors the Democratic correlations are positive and the Republican correlations are negative. |