(Back to
Politics)
(Back to Economy and Political
Parties)
(Go to data table at bottom.)
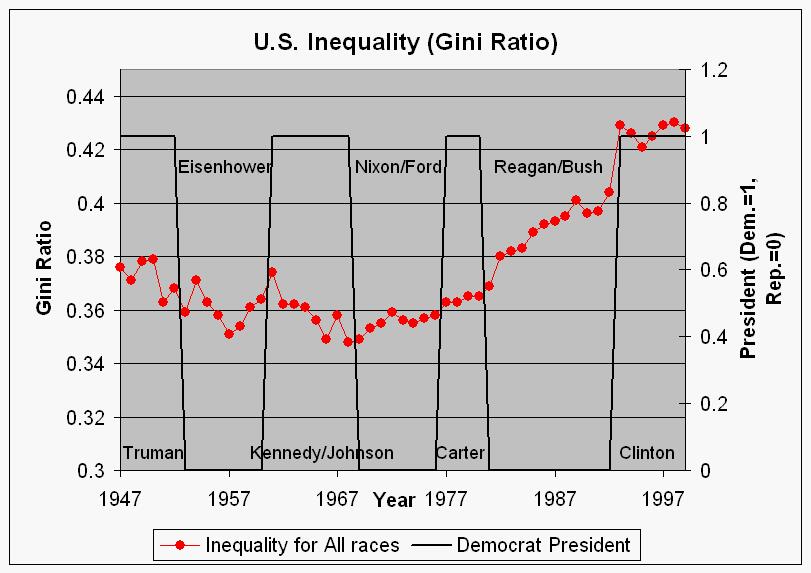
There is a measure of income inequality called the Gini index or Gini ratio. "The Gini ratio (or index of income concentration) is a statistical measure of income equality ranging from 0 to 1. A measure of 1 indicates perfect inequality; i.e., one person has all the income and the rest have none. A measure of 0 indicates perfect equality; i.e. all people having equal shares of income."-from http://blue.census.gov/hhes/income/defs/alldef.html. (Also, see http://www.iadb.org/exr/IDB/stories/1998/eng/e1198i.htm.) The Gini ratios for the U.S. are available at: http://www.census.gov/hhes/income/histinc/f04.html (See table at bottom.)
|
| This shows the Gini ratio since 1947. Note the large rise in inequality during the Reagan-Bush administrations and the leveling off during the Clinton administration. The huge increase for the first year of the Clinton administration appears to be the continuing momentum from the Bush administration. |
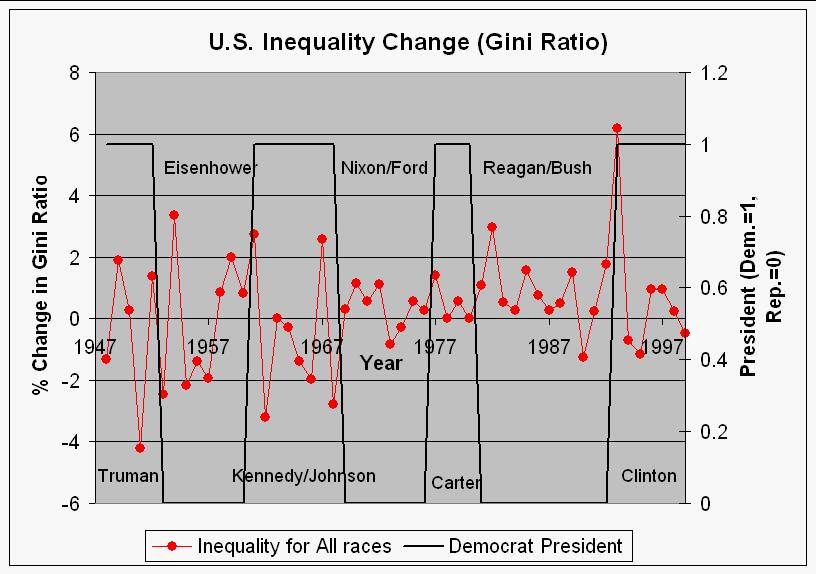 |
| This shows the % change in the Gini ratio since 1947. Note that the change was positive for every year during the Reagan/Bush administration except for 1990, and the very large increase in the first year of the Clinton administration and then decreases in the following two years. The huge increase for the first year of the Clinton administration appears to be the continuing momentum from the Bush administration. Also, note that the change was negative for every year in the Kennedy/Johnson administration except for two years, one of which was zero. |
The following table shows the correlation coefficients for the % change in the Gini ratio and measures of Democratic Party control. Note that Democratic control by either measure correlates with decreasing inequality; therefore, Republican control correlates with increasing inequality. If the first Clinton-administration year huge increase is credited to the Bush administration, the Democrat President correlation is -0.226 .
| Correlations Coefficients | % Change in Inequality |
| Democrat President | -0.104 |
| Democrat Control Index | -0.095 |
(Back to the top of
Income Inequality and Political Parties)
(Back to
Economy and Political Parties)
(Back to
Politics)
The United States does not fare very well when comparing
its Gini ratio to other countries; it is 54th out of 92 countries for which
data are available. (See below for a table.) All of the
European countries and Canada are far ahead. Some selected countries are shown
in the following graph: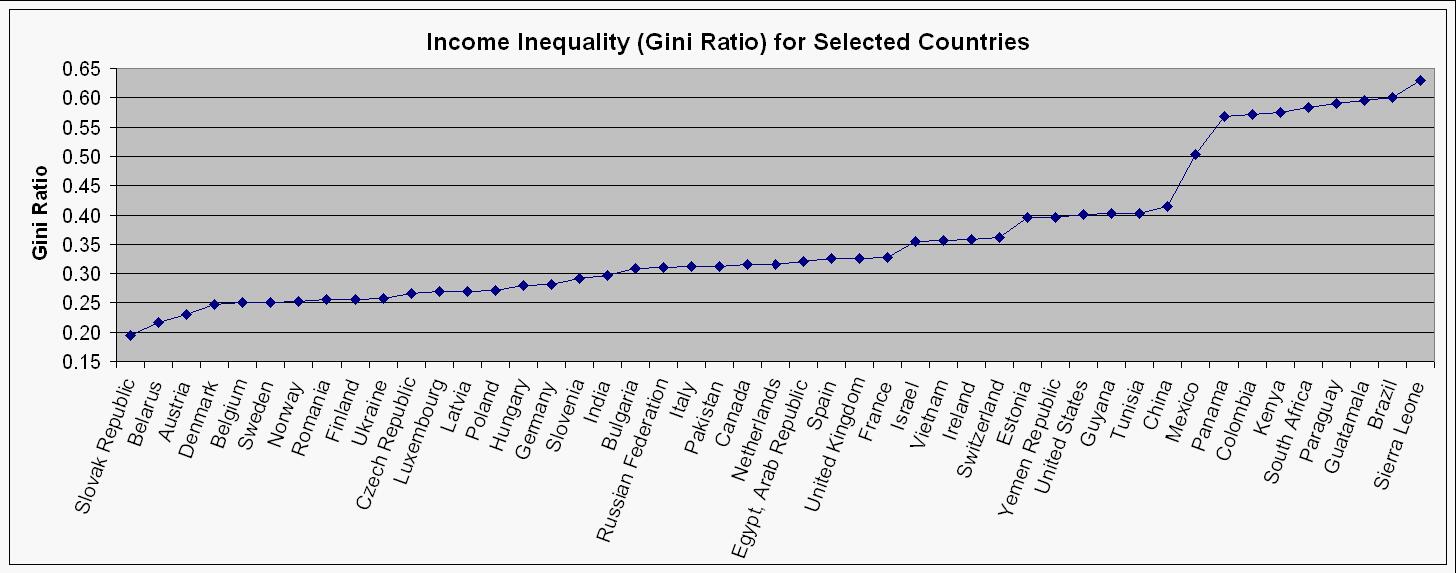
U. S. average Hourly Earnings in Private Industry (1982 $) for 1964-2000 are available at http://stats.bls.gov/top20.html#OCWC .
(Back to the top of
Income Inequality and Political Parties)
(Back to
Economy and Political Parties)
(Back to
Politics)
| Comparison of Different Countries (1998 World Development Report): | ||
| http://www.worldbank.org/data/pdfs/tab2_8.pdf | ||
| Country | Gini Ratio | Rank |
| Slovak Republic | 0.195 | 1 |
| Belarus | 0.216 | 2 |
| Austria | 0.231 | 3 |
| Denmark | 0.247 | 4 |
| Belgium | 0.25 | 5 |
| Sweden | 0.25 | 6 |
| Norway | 0.252 | 7 |
| Romania | 0.255 | 8 |
| Finland | 0.256 | 9 |
| Ukraine | 0.257 | 10 |
| Czech Republic | 0.266 | 11 |
| Luxembourg | 0.269 | 12 |
| Latvia | 0.27 | 13 |
| Poland | 0.272 | 14 |
| Hungary | 0.279 | 15 |
| Germany | 0.281 | 16 |
| Bangladesh | 0.283 | 17 |
| Rwanda | 0.289 | 18 |
| Slovenia | 0.292 | 19 |
| India | 0.297 | 20 |
| Sri Lanka | 0.301 | 21 |
| Lao PDR | 0.304 | 22 |
| Bulgaria | 0.308 | 23 |
| Russian Federation | 0.31 | 24 |
| Italy | 0.312 | 25 |
| Pakistan | 0.312 | 26 |
| Canada | 0.315 | 27 |
| Netherlands | 0.315 | 28 |
| Egypt, Arab Republic | 0.32 | 29 |
| Spain | 0.325 | 30 |
| United Kingdom | 0.326 | 31 |
| France | 0.327 | 32 |
| Kazakhstan | 0.327 | 33 |
| Mongolia | 0.332 | 34 |
| Lithuania | 0.336 | 35 |
| Australia | 0.337 | 36 |
| Ghana | 0.339 | 37 |
| Indonesia | 0.342 | 38 |
| Moldavia | 0.344 | 39 |
| Algeria | 0.353 | 40 |
| Kyrgyz Republic | 0.353 | 41 |
| Israel | 0.355 | 42 |
| Vietnam | 0.357 | 43 |
| Turkmenistan | 0.358 | 44 |
| Ireland | 0.359 | 45 |
| Niger | 0.361 | 46 |
| Switzerland | 0.361 | 47 |
| Nepal | 0.367 | 48 |
| Ivory Coast | 0.369 | 49 |
| Tanzania | 0.381 | 50 |
| Morocco | 0.392 | 51 |
| Estonia | 0.395 | 52 |
| Yemen Republic | 0.395 | 53 |
| United States | 0.401 | 54 |
| Guyana | 0.402 | 55 |
| Tunisia | 0.402 | 56 |
| Uganda | 0.408 | 57 |
| Jamaica | 0.411 | 58 |
| China | 0.415 | 59 |
| Bolivia | 0.42 | 60 |
| Mauritania | 0.424 | 61 |
| Philippines | 0.429 | 62 |
| Jordan | 0.434 | 63 |
| Madagascar | 0.434 | 64 |
| Peru | 0.449 | 65 |
| Nigeria | 0.45 | 66 |
| Thailand | 0.462 | 67 |
| Zambia | 0.462 | 68 |
| Ecuador | 0.466 | 69 |
| Guinea | 0.468 | 70 |
| Venezuela | 0.468 | 71 |
| Costa Rica | 0.47 | 72 |
| Malaysia | 0.484 | 73 |
| El Salvador | 0.499 | 74 |
| Mexico | 0.503 | 75 |
| Nicaragua | 0.503 | 76 |
| Dominican Republic | 0.505 | 77 |
| Papua New Guinea | 0.509 | 78 |
| Honduras | 0.537 | 79 |
| Senegal | 0.541 | 80 |
| Lesotho | 0.56 | 81 |
| Guinea-Bissau | 0.562 | 82 |
| Chile | 0.565 | 83 |
| Panama | 0.568 | 84 |
| Zimbabwe | 0.568 | 85 |
| Colombia | 0.572 | 86 |
| Kenya | 0.575 | 87 |
| South Africa | 0.584 | 88 |
| Paraguay | 0.591 | 89 |
| Guatamala | 0.596 | 90 |
| Brazil | 0.601 | 91 |
| Sierra Leone | 0.629 | 92 |
(Back to top of data
table)
(Back to the top of Income Inequality and
Political Parties)
(Back to Economy and Political
Parties)
(Back to Politics)