(Back to
Politics)
(Back to Economy and Political
Parties)
Back to Presidents' and Congresses'
Economy Scores
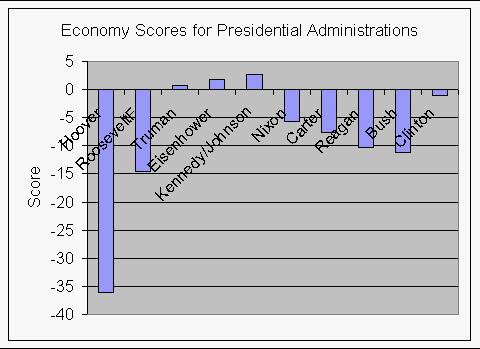
The scores and its components of the scores for presidential administrations since 1929 are shown in the graphs below and in the data table below the graph.
|
Presidents' Economy Scores. Note the unfortunate situation of Democratic President Carter's 4-year term being after an 8-year-term Republican administration and the fortunate situation of Republican Eisenhower being after a 20-year-term Democratic administration. Note that the Reagan/Bush administrations are worse than the Franklin Roosevelt administration during World War II. Of course, the Roosevelt administration not only had to overcome the bad economy of the Hoover administration but, also, had to fight a major war. The Nixon administration started a major slide that the Carter administration could not overcome and the Reagan/Bush administrations continued the bad situation, with Bush slightly improving over Reagan. The Clinton administration began the rise back to good economic times. |
 |
GDP Averages used to calculate Presidents' Economy Scores. |
 |
Federal Debt Averages used to calculate Presidents' Economy Scores. They are plotted with a negative sign to indicate that they contribute negatively to the economy score. |
 |
|CPI| Averages used to calculate Presidents' Economy Scores. They are plotted with a negative sign to indicate that they contribute negatively to the economy score. |
 |
Unemployment Averages used to calculate Presidents' Economy Scores. They are plotted with a negative sign to indicate that they contribute negatively to the economy score. |
The table below gives the values used to calculate the economy scores for presidential administrations since 1929.
| President | Average % GDP Change | Average % Debt Increase | Average ABS(% CPI change) | Average Change % Unemployed | Combined Averages (G-D-|C|-U) | Years |
| Hoover | -17.10 | 5.13 | 7.07 | 6.80 | -36.09 | 4* |
| RooseveltF | 11.25 | 23.91 | 3.52 | -1.67 | -14.51 | 13 |
| Truman | 7.16 | 0.06 | 6.16 | 0.16 | 0.79 | 7 |
| Eisenhower | 4.98 | 1.45 | 1.49 | 0.31 | 1.73 | 8 |
| Kennedy/Johnson | 7.10 | 2.67 | 2.05 | -0.25 | 2.63 | 8 |
| Nixon | 9.07 | 7.91 | 6.36 | 5.84 | -11.03 | 8 |
| Carter | 11.28 | 9.23 | 9.73 | 6.54 | -14.22 | 4 |
| Reagan | 7.86 | 13.78 | 4.65 | 7.54 | -18.11 | 12 |
| Bush | 5.47 | 11.80 | 4.35 | 6.30 | -16.99 | 4 |
| Clinton | 5.68 | 4.86 | 2.36 | 5.21 | -6.75 | 8 |
| Total | Total | Total | Total | Total | ||
| Democrat | 42.47 | 40.72 | 23.80 | 9.99 | -32.05 | |
| Republican | 10.28 | 40.07 | 9.78 | 26.79 | -66.36 | |
| * Data available only for the last 3 years. | ||||||
| For the CPI average the absolute value is used; that is, inflation and deflation are considered equally bad. | ||||||
| For the combined averages CPI is taken as the absolute value for the same reason. | ||||||
| Back to
top of Graphs of the Components of the Economy Scores (Back to Politics) (Back to Economy and Political Parties) Back to Presidents' and Congresses' Economy Scores |
||||||