(Back to
Politics)
(Back to Economy and Political
Parties)
Back to Presidents' and Congresses'
Economy Scores
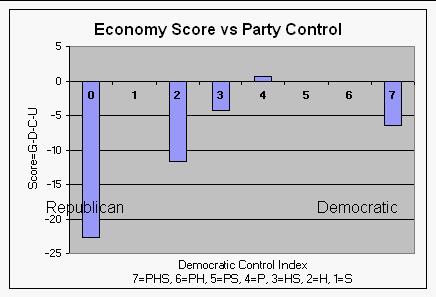
The scores and its components of the scores for versus the party control index since 1929 are shown in the graphs below and in the data table below the graph.
|
Economy Score Versus Party Control Index. Note that the highest scores occurred for years when Democratic party control was stronger than Republican control (index between 3 and 7); that is for years when the presidency was Democratic (index between 4 and 7) or the Congress was totally Democratic (index 3). The lowest scores occurred for years when there was a Republican president either with Republican control of the Congress or only one house controlled by Democrats. |
 |
GDP Averages used to calculate Party Control Economy Scores. Highest values occur for Democratic control. |
 |
Federal Debt Averages used to calculate Party Control Economy Scores. They are plotted with a negative sign to indicate that they contribute negatively to the economy score. Highest value occurred for a Democratic president and Republican congress (index 4). |
 |
|CPI| Averages used to calculate Party Control Economy Scores. They are plotted with a negative sign to indicate that they contribute negatively to the economy score. It is fairly even between party control, with a leaning toward mixed party control. |
 |
Unemployment Averages used to calculate Party Control Economy Scores. They are plotted with a negative sign to indicate that they contribute negatively to the economy score. Democratic control is obviously much better than Republican control for high employment. |
The table below gives the values plotted above:
| Democrat Control | Average % GDP Change | (-Average % Debt Decrease) | Average[ -ABS(% CPI change)] | (-Average Decrease % Unemployed) | Combined Averages (G-D-C-U) | Years |
| 0 | -9.01 | -4.57 | -4.54 | -4.59 | -22.71 | 5 |
| 1 | 0 | |||||
| 2 | 8.10 | -14.82 | -4.92 | 0.03 | -11.60 | 6 |
| 3 | 7.11 | -6.80 | -4.32 | -0.23 | -4.23 | 20 |
| 4 | 6.95 | -1.80 | -4.77 | 0.28 | 0.67 | 8 |
| 5 | 0 | |||||
| 6 | 0 | |||||
| 7 | 9.04 | -12.21 | -3.98 | 0.76 | -6.39 | 32 |