CNN Exit Polls for 2000
Presidential Election
(Back to
Politics)
The CNN exit polls are at
http://www.cnn.com/ELECTION/2000/epolls/US/P000.html.
Some interesting graphs created from the numbers of those polls are:
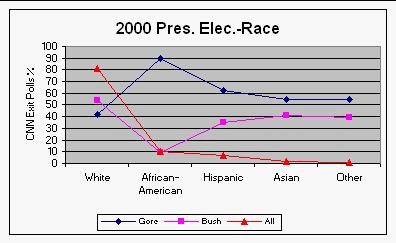 |
CNN Exit Polls: Note that the only race for Bush was white. In
particular, African-Americans were 90% for Gore! |
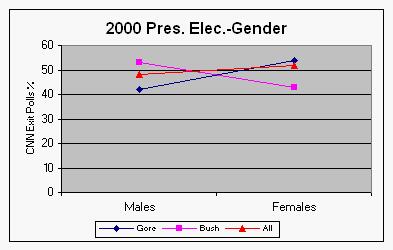 |
CNN Exit Polls: Males were for Bush and females were for Gore. |
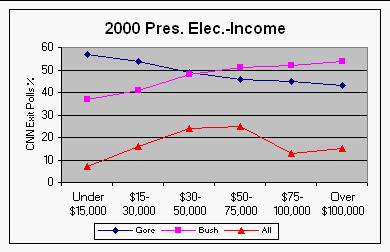 |
CNN Exit Polls: The more well-to-do people were for Bush and others
were for Gore. |
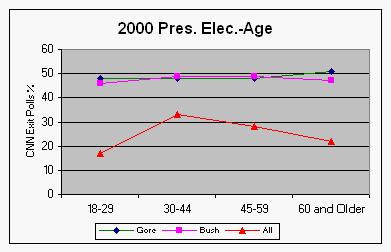 |
CNN Exit Polls: Middle-aged people were for Bush and
the young and old were for Gore. |
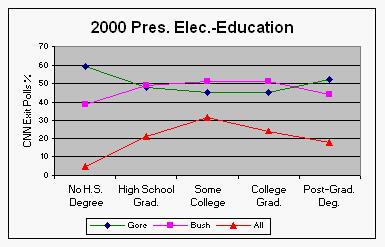 |
CNN Exit Polls: Partially-educated people were for Bush and the
uneducated and highly educated were for Gore. |
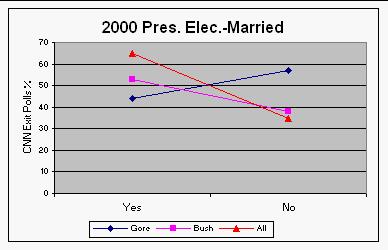 |
CNN Exit Polls: Married people were for Bush and the unmarried were
for Gore. |
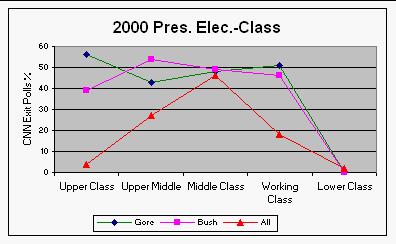 |
CNN Exit Polls: Upper-middle-class people were for Bush and the
upper-class and working-class were for Gore. The middle class was a virtual
tie. |
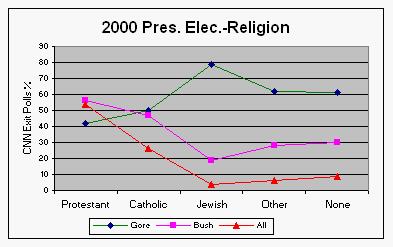 |
CNN Exit Polls: Protestants were for Bush and all others were for
Gore. |
| Election Demographics: |
Gore=Black |
Bush=Red |
|
|
|
| Gender: |
Males 53% |
Females
54% |
|
|
|
|
| Married: |
Yes 53% |
No 57% |
|
|
|
|
| Political Party: |
Democrat 86% |
Republican 91% |
Independent 47% |
|
|
|
| Idealogy: |
Liberal 80% |
Moderate 52% |
Conservative 81% |
|
|
|
| Age: |
18-29 48% |
30-44 49% |
45-59 49% |
60 and
Older 51% |
|
|
| Race: |
White 54% |
African-American 90% |
Hispanic 62% |
Asian 55% |
Other
55% |
|
| Education: |
No H.S. Degree 59% |
High School Grad. 49% |
Some College 51% |
College Grad. 51% |
Post-Grad. Deg. 52% |
|
| Class: |
Upper Class 56% |
Upper Middle 54% |
Middle Class 49% |
Working Class 51% |
Lower Class 0% |
|
| Income: |
Under $15,000 57% |
$15-30,000 54% |
$30-50,000 49% |
$50-75,000 51% |
$75-100,000 52% |
Over $100,000 54% |
So the voting pattern for the election is that one class of
people, namely the white, well-to-do, middle-aged males favored Bush and ALL
OTHER categories of people favored Gore. This appears to me to be a remarkable
thing!