L. David Roper
http://www.roperld.com/personal/roperldavid.htm
06-Apr-2016
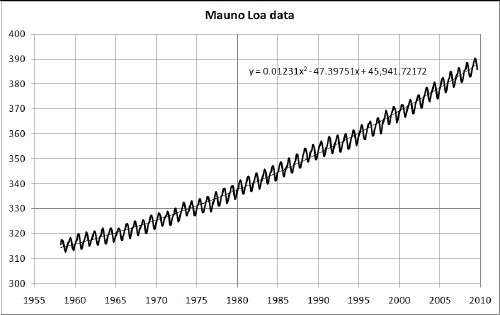
Since 1958 the monthly atmospheric carbon-dioxide concentration has been measured at the Mauna Loa Observatory at 11,135 feet (3394 m) in Hawaii. The plotted data comprise the Keeling Curve:
The unit of concentration is parts per million by volume, ppmv.
The smooth line through the seasonal oscillating data is a quadratic fit to the data. It will be shown below that there are other variations from the quadratic fit besides the seasonal oscillations.
Carbon-dioxide concentration in the atmosphere has been rising quadratically since it started being measured in 1958. The following graph shows that it would rise to almost 680 ppmv by 2100 if it continues to rise in the same way:
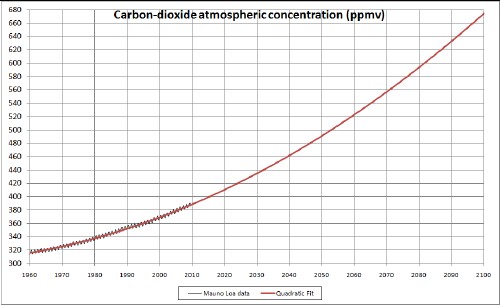
Such a high concentration would be devastating for planet Earth! We all must do all we can to keep this from happening. Invest in energy conservation, renewable energy and education instead of other investments.
In 2009 it was 388 ppmv. Before industrialization (c1750) it was about 280 ppmv.
There is a world-wide movement to reduce carbon-dioxide atmospheric concentration to 350 ppmv. 24 October is to be a day all over the world to emphasize reduction to 350 ppmv.
Here is a possible trajectory for reducing CO2 concentration to 350 ppmv:
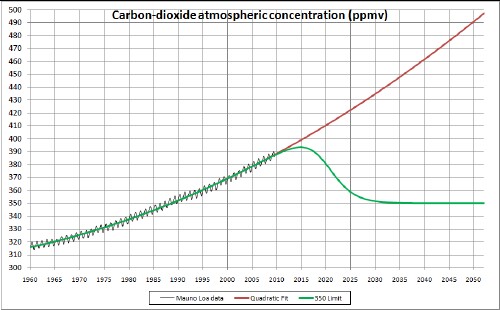
To accomplish this will require all of us to make huge efforts to reduce energy consumption and invest in energy conservation and renewable energy.
The oscillating behavior of the Mauna Loa data can be fitted very well by a sum of three sinusoidal functions. To do the fit I subtracted the quadratic fit from the data:
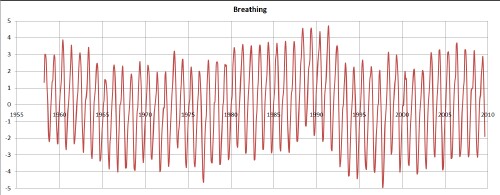
This curve could be called the Earth Breathing Curve.
The fit parameters are:
Chi Sq |
a |
t0 |
L |
a |
t0 |
L |
a |
t0 |
L |
b |
c |
d |
342 |
0.269 |
241.5 |
8.773 |
0.732 |
200.2 |
28.23 |
2.77 |
2.347 |
0.99885 |
12.30546 |
47.3977 |
45.94269 |
The first 9 parameters are three sets for the sine functions {sin[2Pi(t-t0)/L]} and the last three parameters are for the quadratic function (b•t3/1000-c•t2+1000d) fit. Note the three wavelengths, L = 8.773 years, 28.23 years and 0.99885 years, the latter being the seasonal oscillation wavelength. The fit is:
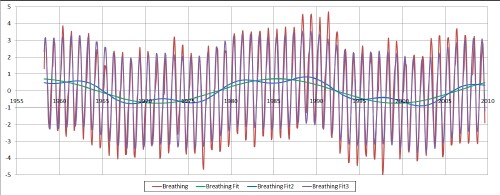
The longest-wavelength sine function and the sum of the two long-wavelength sine functions are shown along with the total fit using all three sine functions. There are some small residual variations not accounted for by the three sine functions.
This is a very good fit; the chi-square is 342 for fitting 617 data points with 12 variable parameters. One cannot get a good fit without the two smaller long-wavelength oscillations.
The fit to the original data is:
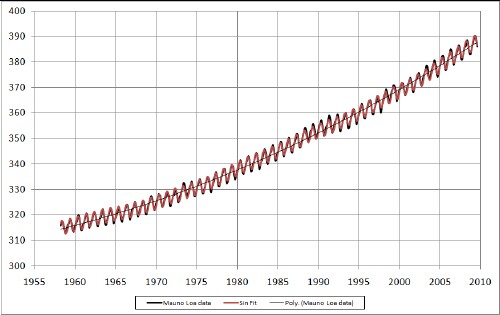
The fit curve is so good that it almost hides the data curve on this ppmv scale. (The black line is the quadratic fit.)
I wonder what physical processes cause the two smaller long-wavelength oscillations. If anyone has any ideas about this, please let me know.
The volcano Mauna Loa had two large eruptions in 1950 and 1984 near the peaks (1957 & 1985) of the middle-sized longest-wavelength sine function; perhaps that sine curve is due to those eruptions. Another peak of that sine function occurs in 2013; perhaps it is a harbinger of a pending eruption of Mauna Loa . The Kilauea volcano near Mauna Loa has erupted more frequently; perhaps the smallest middle-wavelength sine function in the fit is due to Kilauea eruptions. The small residual variations not accounted for by the three sine functions may be due to irregular volcano activity.
It is interesting that the seasonal wavelength is 0.99885 years instead of 1 year. Apparently the seasonal period has decreased due to global warming, assuming that before industrialization the seasonal period was 1 year. In the 51 years since the Mauna Loa CO2 measurements began in 1958 the accumulated shift in the seasonal oscillation to earlier times is (1-0.99885)*51 = 0.05865 years or 0.7038 months. Apparently global warming caused by the increase in CO2 concentration has shifted the seasonal CO2 oscillation to earlier times as it has decreased the interval between summer and winter seasons. If others have ideas about this, I would like to hear them.
L. David Roper interdisciplinary studies
L. David Roper, http://www.roperld.com/personal/roperldavid.htm; roperld@vt.edu