
L. David Roper
http://www.roperld.com/personal/roperldavid.htm
6 April, 2016
A measure of the Earth's average temperature is available from the Antarctica ice-core data back to 422,000 years-before-present (ybp; present = 1990) (Ref. 1). (The Earth temperature is probably about half of the Antarctica temperature.)
Solar insolation has been calculated over a large expanse of years (Ref. 2). One can reason that the insolation near the North Pole should be more important for determining climate than at other places, because most of the land ice is there and the amount of ice is a large factor in climate. However, the temperature data mentioned above are for Antarctica, all the way around the world from the North Pole.
In this work I calculate the correlation coefficients for solar insolation versus Antarctica average temperature for 15 June and for 15 December for latitude intervals of 10 degrees. The reason for doing this is to find out which latitudes have the highest correlation with Antarctica temperature. It turns out that the North-Pole or near-North-Pole insolation has the highest correlation with the Antarctica temperature.
The average Antarctica temperature relative to 1990 from 422,000 ybp are shown in the following graph with the insolation at the North Pole for 15 June:

Insolation for 15 June for latitude intervals of 10 degrees is shown in the following graph:

Of course, the insolation is zero for latitudes less than -66.56 degrees (66.56 degrees South), because of the 23.44 degrees tilt of the Earth's axis.
Insolation for 15 December for latitude intervals of 10 degrees is shown in the following graph:
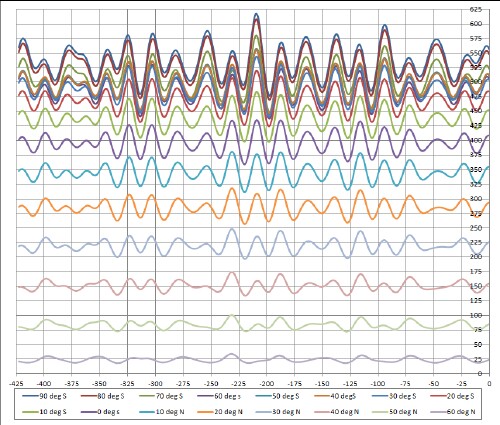
Of course, the insolation is zero for latitudes greater than 66.56 degrees (66.56 degrees North), because of the 23.44 degrees tilt of the Earth's axis.
Correlation coefficients were calculated using the CORREL function in Microsoft Excel.
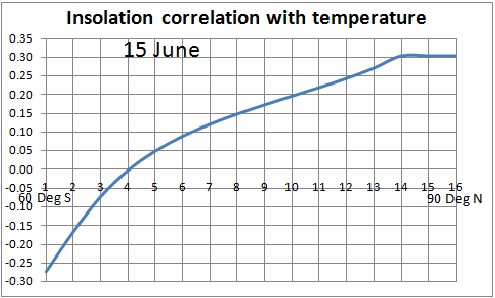
The correlation coefficents for Antarctic average temperature and insolation for 10-degrees-latitude intervals for 15 June are shown in the following graph:
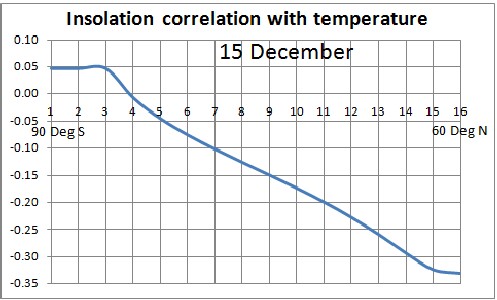
The correlation coefficents for Antarctic average temperature and insolation and 10-degrees-latitude intervals for 15 December are shown in the following graph:
Since the North-Pole summer insolation has the maximum correlation with average Antarctica temperature, I did correlation lag calculations for those two variables. The result is shown in the following graph:
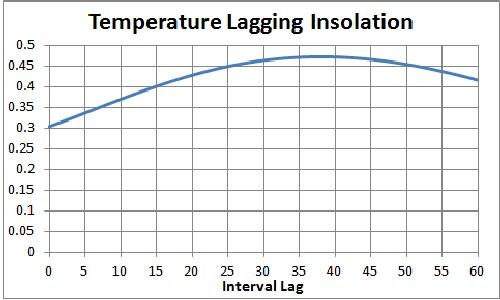
The lag is about 38 time intervals. The time intervals in the Antarctica-ice-cores are not constant. The average interval is 128 years and the interval standard deviation is 113 years. So, a lag of 38 intervals corresponds to an time lag of 4.85±4.30 kiloyears, a not very useful number.
Visually, the first graph in this article, showing the summer-North-Pole insolation and the Antarctica temperature, the correlation for the Last Major Ice Age appears higher than for previous Major Ice Ages. So I did the correlation calculation for the Last Major Ice Age. The result is shown in the following graph:
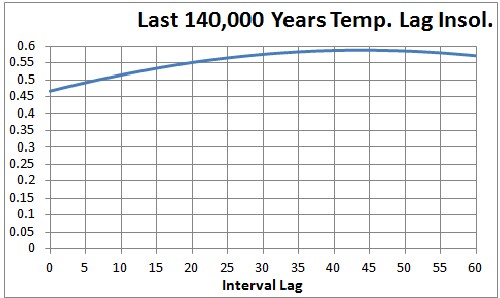
The lag is about 44 time intervals. The average interval is 71 years and the interval standard deviation is 16 years. So, a lag of 44 intervals corresponds to an time lag of 3.13 ±0.73 kiloyears. So, the time lag of temperature behind summer-North-Pole insolation is about 3000 years.
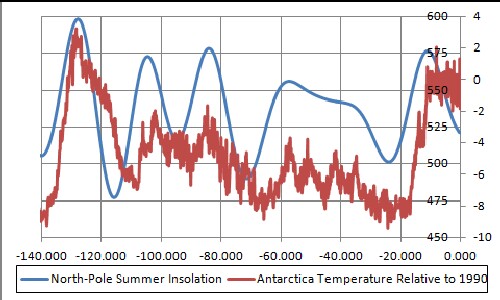
The next two graphs show the summer-North-Pole insolation and the Antarctica temperature with no lag and with a 44-interval lag:
 |
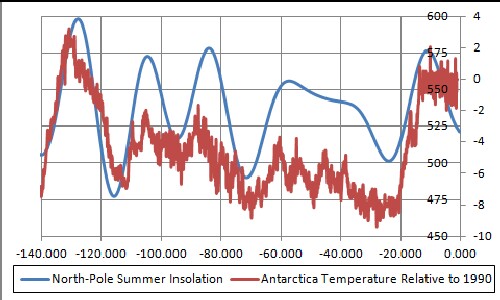 |
The improvement of correlation with the lag is visually obvious. Also obvious, on the right side, is that anthropogenic global warming has prevented the temperature from following the summer North-Pole insolation during the Current Major Interglacial.
In a previous work I did a transitions-model fit to the average Antarctic temperature data using two identical Earth states in the time region of each Major Interglacial and the summer solar insolation. The following graph shows the fit for the last Major Ice Age including the last Major Interglacial and the current Major Interglacial:
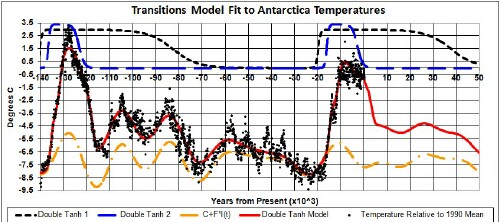
Note that the shorter-lived Earth state starts after the longer-lived state.
Here is an equally good fit:
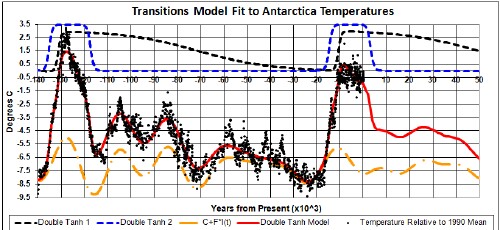
I worked to get this fit because I think that it makes better physical sense: The first shorter-lived state starts before the second longer-lived state. The shorter-lived state could be due to release of methane from methane clathrates because they have been exposed by a very low sea level. The later longer-lived state could be due to carbon dioxide created by the methane reacting with atmospheric oxygen and from release from the land and ocean caused by the increasing temperature.
The two correlation graphs above show that the highest correlation between insolation and Antarctica temperature occurs for 70 to 90 degrees north latitude, at or near the North Pole.
Roper Global-Heating Web Pages
L. David Roper interdisciplinary studies