The temperature zero is the mean temperature from 1961-1990.
L. David Roper
http://www.roperld.com/personal/roperldavid.htm
6 April, 2016
I recently showed that Earth average temperature lags atmosphere CO2 concentration since 1959 by about 6 years.
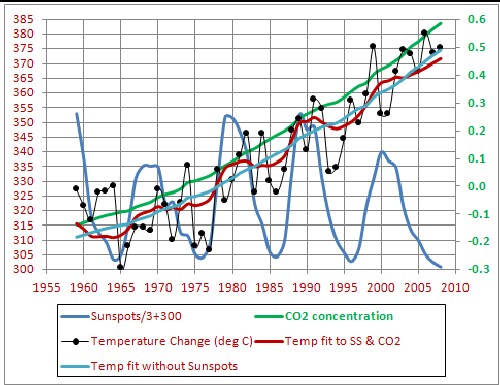
In the work reported here I did a linear fit of the Earth average temperature to the atmospheric CO2 concentration from 1959 to 2008. Then I add sunspot numbers to the fit. It is known that an increase in sunspot numbers correlates with a slight increase of solar radiation.
http://en.wikipedia.org/wiki/Sunspots:
"The number of sunspots correlates with the intensity of solar radiation over the period since 1979, when satellite measurements of absolute radiative flux became available. Since sunspots are darker than the surrounding photosphere it might be expected that more sunspots would lead to less solar radiation and a decreased solar constant. However, the surrounding margins of sunspots are brighter than the average, and so are hotter; overall, more sunspots increase the sun's solar constant or brightness. The variation caused by the sunspot cycle to solar output is relatively small, on the order of 0.1% of the solar constant (a peak-to-trough range of 1.3 W m−2 compared to 1366 W m−2 for the average solar constant). Sunspots were rarely observed during the Maunder Minimum in the second part of the 17th century (approximately from 1645 to 1715). This coincides with the middle (and coldest) part of a period of cooling known as the Little Ice Age."
The equation for the fit is T = -3.384 + 0.000587*Sunspots + 0.01001*CO2 . The fit is shown in the following graph:
The temperature zero is the mean temperature from 1961-1990.
The chi-square for the fit without using sunspot numbers is 0.5118; using sunspot numbers it is 0.4728, a 7.6% decrease.
Subtracting the fit from the data yields the remainder curve shown in the following graph:
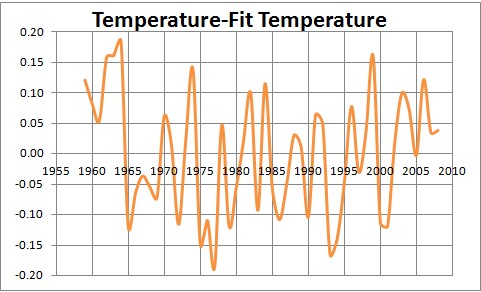
There appears to be an approximate oscillating period of about 0.7 years, but with a non-constant amplitude.
After completing the above work I decided to extend it back to 1880 for which good values for Earth average temperatures are known. To do this I had to find a way to extend the atmospheric CO2 concentration from 1959 back to 1880. I did this by fitting a hyperbolic tangent to the atmospheric CO2 concentration data between 1959 and 2008. The resulting atmospheric CO2 concentration and sunspot numbers are shown in the following graph:

The linear fit of the Earth average temperature to the atmospheric CO2 concentration and both the atmospheric CO2 concentration and the sunspot numbers are shown in the following graph:
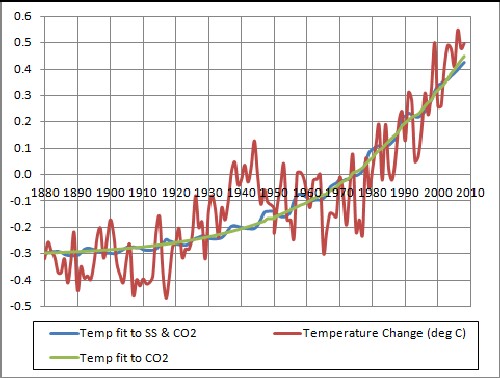
The temperature zero is the mean temperature from 1961-1990.
The chi-square for the fit without using sunspot numbers is 1.6648; using sunspot numbers it is 1.6365, a 1.6% decrease. So, over this larger yearly range, sunspot numbers do not effect the Earth average temperature very much
The Earth-average-temperature data are fitted well by a linear equation in the atmospheric CO2 concentration, except for an approximate oscillation of period about 0.7 years. Adding a linear term for sunspot numbers inproves the fit, but still leaves the approximate 0.7-years oscillation.
Roper Global-Heating Web Pages
L. David Roper interdisciplinary studies