Energy, Global Warming
and the
Next Major Ice Age
L. David Roper
http://www.roperld.com/personal/roperldavid.htm
23 November 2007
Contents
- Climate-Changing Earth-States
Transitions
- Two Earth-States Transitions
- Prediction of Future Earth
Temperatures
- Conclusion
- References
- Related Studies
Introduction
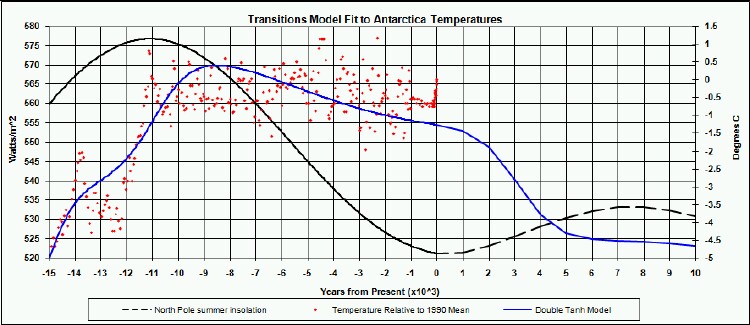
The past average atmospheric temperatures above Antarctica for the last 425,000 years are known with good accuracy from ice cores extracted at Vostok (Ref. 1), as shown in Fig. 1.
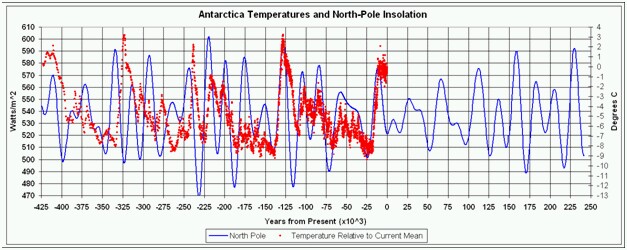
Figure 1. Average atmospheric temperature above Antarctica (right axis; tuned data; Ref. 1) and
North-Pole insolation
(left axis; Ref. 2)) for the last 425,000 years.
The insolation is extended out to 250,000 years into the future. The earliest temperatures are of lower accuracy than the latest temperatures. Four past Major Ice Ages are clearly seen. (1990 is zero time in this graph and the graphs below.)
Some major features of Fig. 1 are:
- There is an obvious correlation between the North-Pole
insolation and the temperature at the South Pole (Antarctica).
- There are repeating Major Ice Ages about every 110,000
years with short Major Interglacials between the
Major Ice Ages.
- There are climate-changing Earth transitions that occur
on several different time scales.
I have studied the Earth transitions involved in the temperature changes during the course of a Major Ice Age and reported the work. Here I concentrate on Earth transitions on time scales of the length of a Major Ice Age.
Climate-Changing
Earth-States Transitions
In this work an equation with variable parameters was devised that fits the Antarctica temperatures for the last four Major Ice age reasonably well. The time dependence comes from the time dependence of the summer North-Pole insolation and double sigmoids in time that represent Earth-state changes. This model is probably related to the multiple-state climate model of Paillard (Ref. 3). The emphasis of this double-sigmoid model is on predicting the future as well as modeling the past, and it uses Antarctica temperatures rather than Earth ice volume as the data to be fitted.
The transitions equation for the Major Ice Ages is:
![]()
The parameters to be varied to fit the temperature data are ![]() . The equation allows the
option of using one or more double sigmoids (the i index) for each Major Ice Age. The tj
parameters were started at the values for the Major Interglacials’
insolation peaks; they then were allowed to vary after the other parameters
were varied for a best fit for the case of using the same sigmoids’
parameters for all Major Ice Ages. For the case of allowing the sigmoids’ parameters to be different for the different
Major Ice Ages, the tj parameters were not
varied because they are linearly combined with the cnij
variable parameters.
. The equation allows the
option of using one or more double sigmoids (the i index) for each Major Ice Age. The tj
parameters were started at the values for the Major Interglacials’
insolation peaks; they then were allowed to vary after the other parameters
were varied for a best fit for the case of using the same sigmoids’
parameters for all Major Ice Ages. For the case of allowing the sigmoids’ parameters to be different for the different
Major Ice Ages, the tj parameters were not
varied because they are linearly combined with the cnij
variable parameters.
I have done a multi-transitions fit to the Last Major Ice Age (LMIA) as shown below:
![]()
Zero time represents the year 1990.
However, here I will fit only two transitions to the LMIA and previous Major Ice Ages in order to predict future temperatures due to Earth transitions, aside from anthropogenic global warming. Then my global-warming prediction will be added in.
Two
Earth-States Transitions
I have fitted the last four Major Ice Ages back to 423,000 years ago with the same two Earth-states transitions (turning on and then turning off) for each Major Ice Age:
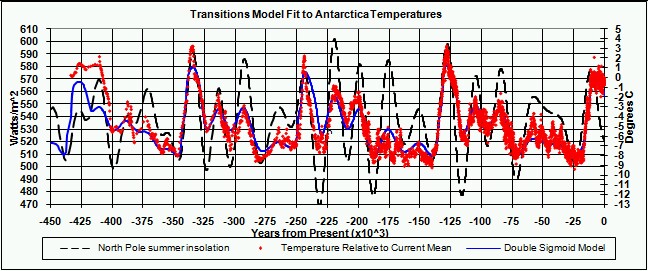
The blue-curve fit is reasonably good since about 400,000 years ago, especially for the last Major Ice Age from about 140,000 years ago. Fitting the Vostok temperature data for just the last Major Ice Age (back to 140,000 years ago) with two double-hyperbolic-tangents representing two Earth-states transitions yields the blue curve in this graph:
Zero time represents the year 1990.
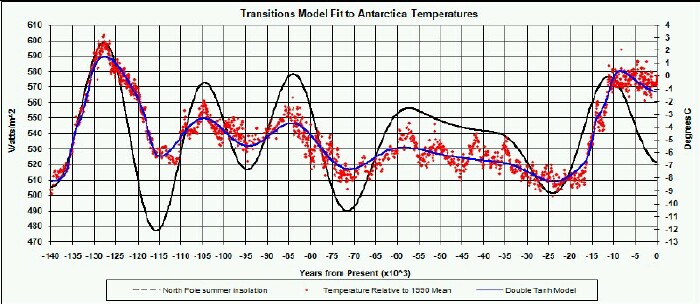
The two Earth-states transitions (black and blue curves for two states turning on and off) and the sum of the two in red are as shown in this graph:
![]()
The three components (North-Pole insolation and the two Earth-states transitions) that are added together to get the fit to the temperature data are shown in this graph for the LMIA:
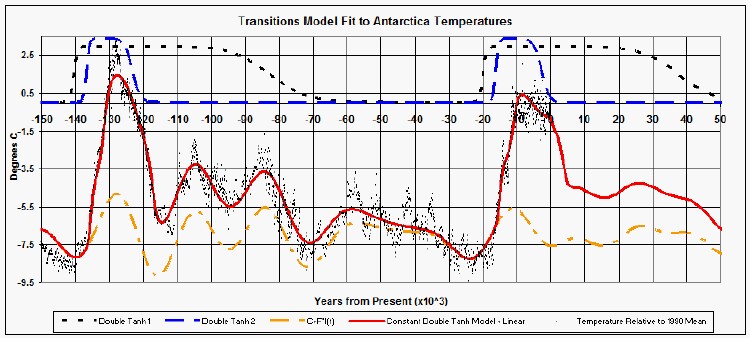
The bottom orange curve is the constant term plus the term proportional to the North-Pole insolation and the top two blue and black curves are the two Earth-states transitions. The insolation provides the variations on a 20,000-year time scale during a Major Ice Age and the Earth-states transitions provide the rapid rise and fall into and out of the Major Interglacials. Although the largest peaks in the North-Pole insolation apparently provide a trigger to acuate the Earth states, they provide only about a third of the temperature rise in the Major Interglacial; the two Earth-states transitions provide about a third each. At the glacial maximum about 23,000 years ago the low insolation was the major driver of the temperature; both Earth states were turned off then, but came on shortly after then.
Prediction
of Future Earth Temperatures
If anthropogenic global warming had not occurred, it appears that the Earth would already be headed into the next Major Ice Age. (1990 is zero time in the graphs above.)
The two-Earth-states fit to Antarctica temperature data described above yields the following graph for the current Major Interglacial:
Note that the measured temperature does not fall as fast as the predicted temperature. Ruddiman (Ref. 4) attributes this to the onset of agriculture about 8000 years ago, which began emiting carbon dioxide into the atmosphere, and the onset of rice farming about 5000 years ago, which began emitting methane into the atmosphere. (Methane has about a seven-year half life reacting with oxygen to produce carbon dioxide and water vapor, all three of which are potent greenhouse gases.) I call this "Neolithic Global Warming" as shorthand for "Neolithic Anthropogenic Global Warming."
The temperature peak in the graph above may be a little high because the high temperatures in recent times due to global warming may have pulled it up in the fit to the data. To account for this I added a linear term to the double-transitions fit to the Antarctica temperature data from -10,000 to -100 years ago, set to zero at -10,000 years, to get a measure of the amount of Neolithic Global Warming (NGW) and decaying after -100 years by the 3-exponential decay used for carbon-dioxide decay in Modern Global Warming; the result is:
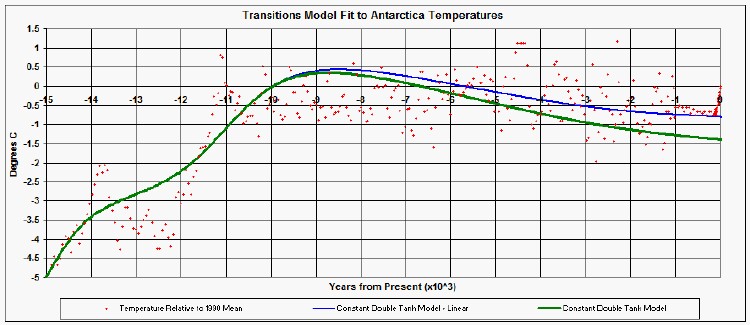
The blue curve is the fit including the Neolithic-Global-Warming linear equation [0.588+0.0586*(year in 1000-year units), which makes it 0 at -10,000 years] and the green curve is the other part of the fit.
Then I subtracted the value of the total temperature fit at year 1700 to normalize the total-temperature peak to that year.
There are indications that the Arctic and Antarctic temperature changes are about double the average Earth temperature changes.
So, I added one-half this curve to the curve I had previously calculated for the temperature rise from 1700 due to global warming using a three-exponential decay curve for carbon dioxide resident in the atmosphere. The result is:
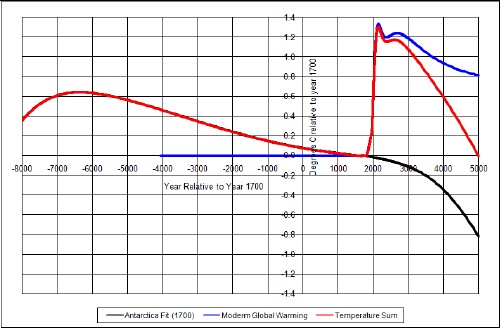
The red curve is the sum of the blue curve (Modern Global Warming normalized to year 1700) and the black curve (fit to Antarctica data normalized to year 1700). The Modern Global Warming curve does not include any non-linear effects, such as methane release in the Arctic.
It is seen that, given the approximations made in these several calculations, the temperature blip due to human activities, since the beginning of the industrial revolution, is a sizable addition to the non-anthropogenic background temperature.
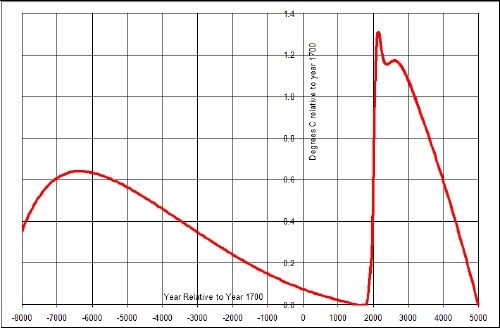
The next graph shows the smoothed past temperature and the estimated future temperature relative to year 1700:
The graph below compares the fit to the Antarctica temperature data with two Earth states turning on and off and the case with Modern Global Warming added:
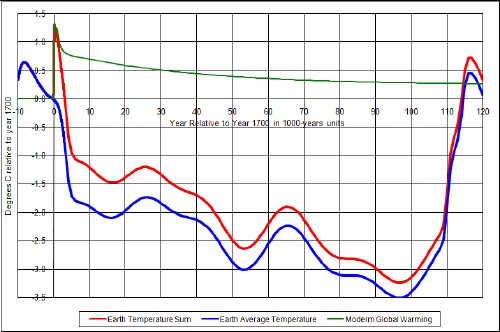
Time scale for this graph is 1000 years; zero is year 1700.
The long residence time of carbon dioxide in the atmosphere due to Modern Global Warming is clearly seen.
The global-warming temperatures shown above were calculated with a constant climate sensitivity of 3. However, there are indications that climate sensitivity is 3 for short times (decades to centuries) and perhaps 6 for long times (millenia).
The following graph shows the global-warming temperature for a climate sensitivity that gradually changes from 3 to 6 by means of a hyperbolic tangent with a change-point of 10,000 years from 1700 and a width of 5000 years.
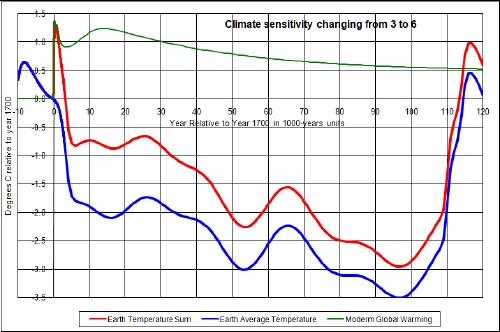
Perhaps the global warming temperature does not decline as much with time as shown in the graphs above.
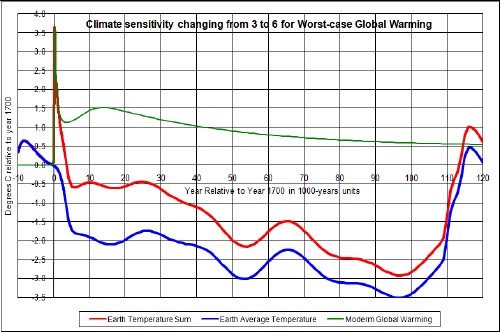
Finally, the following curve shows a "worst case" for modern global warming, including some non-linear effects:
Conclusion
The "short" peak on a geological scale of Modern Global Warming due to burning fossil fuels and other emissions of carbon into the atmosphere by human activity is in one sense a small perturbation, but global warming has slightly delayed the entry into the next Major Ice Age. But, the final temperature fall into the depths of the next Major Ice Age will be faster initially than it would be without global warming.
Homo sapiens evolved into "intelligent" animals over the last 150,000 years due to the extreme climate changes from the end of the penultimate Major Ice Age about 140,000 years ago through the last Major Interglacial about 130,000 years ago into the beginning of the last Major Ice Age, as shown in the following graph:
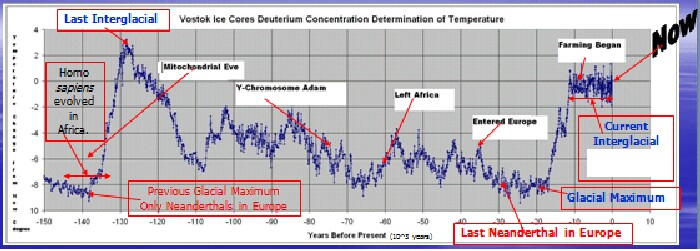
Mitochondrial Eve
(lived c140,000 years ago) is the matrilineal most recent common ancestor of
all living humans.
Y-chromosome Adam
(lived c75,000 years ago) is the patrilineal most recent common ancestor of all
lving men.
Surely there will be major evolutionary changes in Homo sapiens as the Earth warms rapidly and then plunges out of Global Warming into the next Major Ice Age, if they survive it.
It would be desirable to spread out the burning of fossil fuels to allow more time for humans to adjust to the fall into the next Major Ice Age. It might be a good idea to store much of the carbon dioxide created by burning fossil fuels to release at a slower rate later to give more time for humans to adjust to the entry into the next Major Ice Age.
References
- Petit, J. R. et al. Climate and atmospheric
history of the past 420,000 years from the Vostok ice core, Antarctica. Nature399,
429-436 (1999). A shorter on-line version is available at http://cdiac.esd.ornl.gov/trends/temp/vostok/jouz_tem.htm.
- Berger, A. et al. Insolation values for the
climate of the last 10 million years. Quaternary Science Reviews
10, 297-317 (1991). I use this code because I was able to create a spreadsheet
version of it, which made it much easier to calculate insolation
values at the times of the many Antarctica temperatures.
- Paillard, D. The timing of Pleistocene glaciations from
a simple multiple-state climate model, Nature 391, 378-381 (1998).
- Ruddiman, William F. Plows,
Plagues and Petroleum: How Humans Took Control of Climate, Princeton
Univ. Press, 2005. A shorter version is in Scientific American,
Mar 2005, p.34.
Related
Studies
Roper Global-Heating Web Pages
http://www.roperld.com/personal/InterdisciplinaryStudies.htm