L. David Roper
http://www.roperld.com/personal/roperldavid.htm
6 April, 2016
Part of climate change is a change in the pattern of evaporation of water into vapor and the precipitation of water vapor into rain, hail, sleet and snow. It is important to have a mathematical representation of evaporation and precipitation as a function of latitude for climate-change calculations.
In this study I create a parametrization of evaporation and precipitation versus latitude.
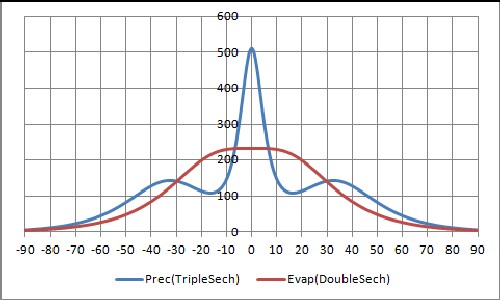
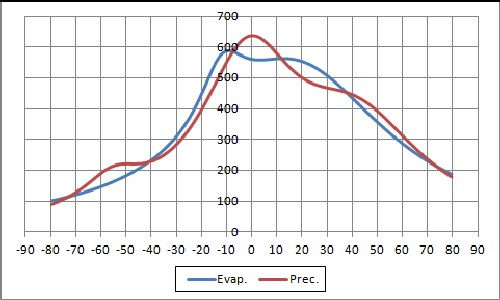
An idealized version of evaporation and precipitation would be symmetrical about the equator. Such an idealization is represented in the following curves:
|
|
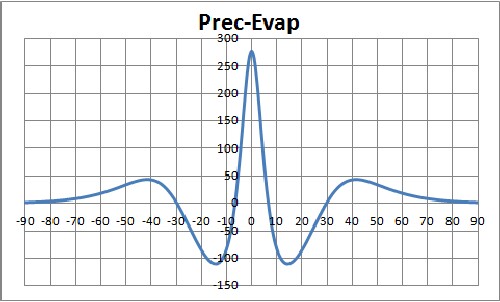
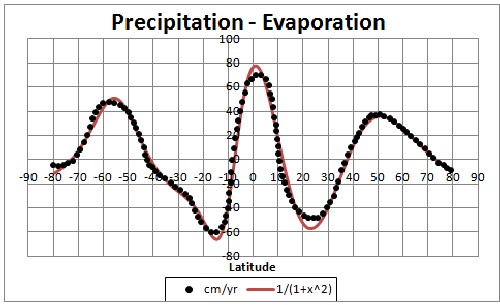
The second graph shows the difference between precipitation and evaporation. It is interesting that precipitation dominates around the equator and at mid-latitudes.
The equations used to create the curves are:
 |
 |
The center function for precipitation could be centered slightly off of L0=0, if desired.
In the two curves above:
| Evaporation: | C+=C-=165; L+=+15; L-=-15; w+=w-=17 |
| Precipitation: | C+=C-=140; C0=450; L +=+33; L-=-33; L0=0; w +=w-=15; w0=4 |
In general, the curves would not be symmetric as the idealized curves above:
An example of the parametrization for an asymmetric cases is:
 |
The fit parameters are:
| Evaporation: | C+=536; C-=198; L+=+17.1; L-=-11.7; w+=43.4; w-=10.9 |
| Precipitation: | C+=326; C-=102; C0=229; L +=+41.8; L-=-55.1; L0=-1.51; w +=32.9; w-=15.0; w0=23.0 |
Note that, for this graph, evaporation and precipitation are greater in the northern hemisphere than in the southern hemisphere.
Of course, there are other peaked functions that could be used other than the 1/cosh used above. Examples are:
1-tanh2[(t-t0)/w] |
1/cosh[(t-t0)/w] |
The first two of these functions had a less-probable fit to the data used. However, there might be other data sets for which one of them yields the best fit.
The parametrization used here makes it possible to simply include precipitation and evaporation in mathematical climate models.
Roper Global-Heating Web Pages
L. David Roper interdisciplinary studies