Global Warming Graphs
L. David Roper
http://www.roperld.com/personal/roperldavid.htm
6 April, 2016
Content
-
- Causes of Global Warming
- Consequences of Global Warming
- Renewable Energy
- Global Warming Mathematics
- Global Climate Change Indicators
Introduction
The central tenet of global warming theory is that the average temperature of the Earth is gradually rising due to certain gases occurring in small concentrations in the upper atmosphere.
There are many consequences that occur when the average temperature of the Earth rises.
This article contains many graphs that depict the average Earth temperature and the consequences.
Average Earth Temperature
Average Earth temperature refers to the air temperature averaged over the surface of the earth.
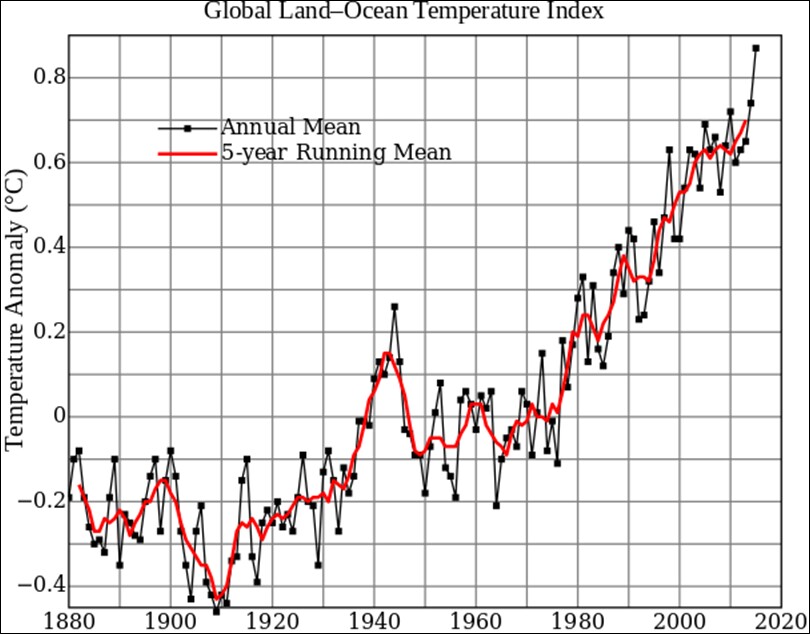
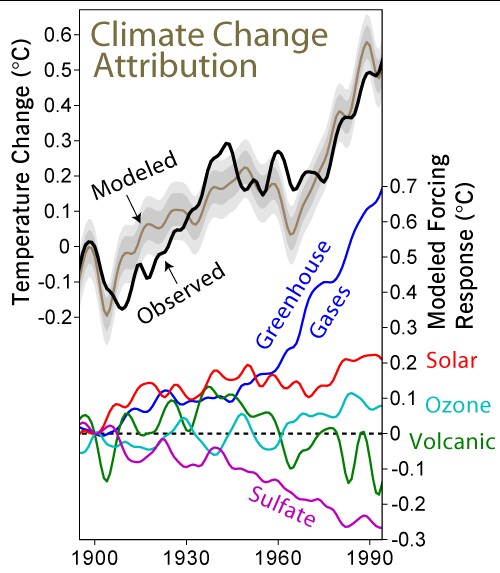
Modern Average Earth Temperature
The following two graphs show recent average Earth temperature and periods of global dimming:
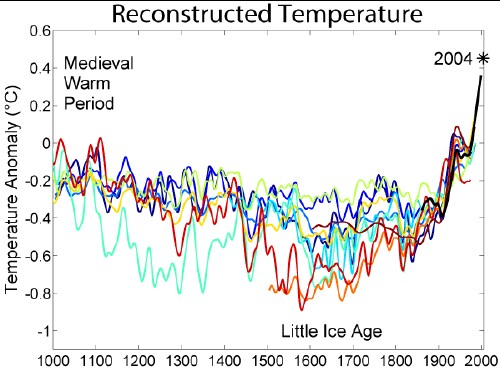
Medieval Average Earth Temperature
Some global-warming deniers claim that the average Earth temperature was higher during the Medieval Warm Period than it is now. The following graph shows that the claim is incorrect.
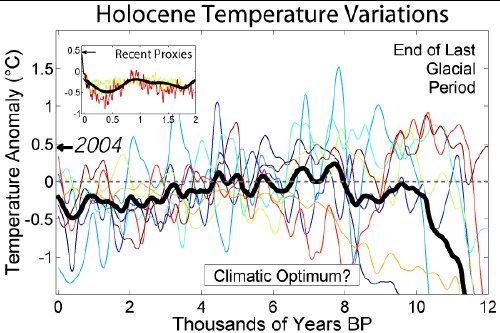
Holocene Average Earth Temperature
Some global-warming deniers claim that the average Earth temperature was higher earlier in the Current Major Interglacial (the Holocene) than it is now. The following graph shows that the claim is incorrect.
Last Major-Ice-Age Average Earth Temperature
The following graph shows average temperature at Antarctica and a two-state model fit to the data:
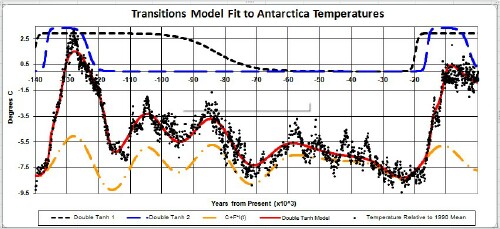
The average Earth temperature is about half the average Antarctic temperature.
The graph shows that it was warmer (about 2°C) than now about 130,000 years ago (Eemian Major Interglacial) and the sea level was 5 to 7 meters higher than today.
Last Four Major-Ice-Ages Average Earth Temperature
The following graph shows average temperature at Antarctica and the summer North-Pole insolation:
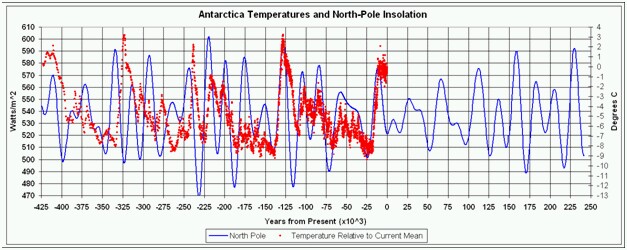
The insolation is projected 250,000 years into the future to give some idea of how average Antarctic temperature might vary then.
The average Earth temperature is about half the average Antarctic temperature.
The graph shows that it was warmer than now during the last four Major Interglacials (~130,000 ybp, ~240,000 ybp, ~325,000 ybp and ~410,000 ybp).
Average Earth Temperature Summary to 540-millions Years Ago
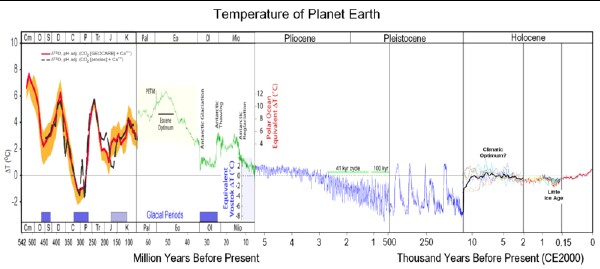
Note that the three panels on the right are expanded above.
The Earth was much warmer than now from about 10 million to about 250 million ybp and from about 350 million to at least about 540 million ybp.
Prior to that it was very cold; the Earth was probably covered with ice (Snowball Earth) ~ 650 mybp, 700 mybp and perhaps ~750 mybp:
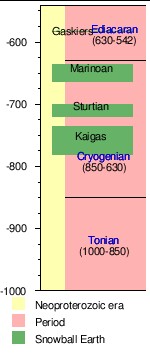 |
Geography of the Earth during Snowball Earth:
The red dots are where glacial deposits exist; many are at the Equator! |
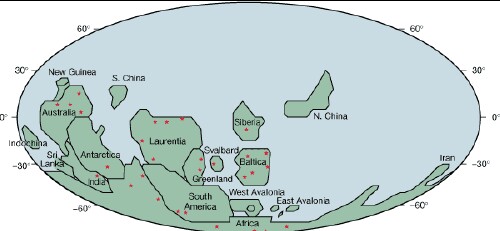
The extreme heat after Snowball Earth occurred because of volcanic activity and the fact that the oceans were covered with perhaps a kilometer of ice, such that they could not absorb the greenhouse gases emitted by the volcanoes.
Ocean Temperature
Deep ocean water is about 3.8 C and has a salinity of about 3.5%.
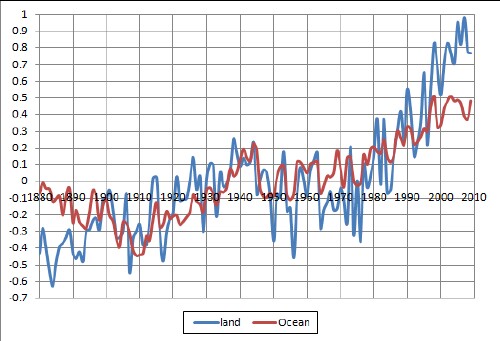
The following graph compares the average ocean temperature and the average land temperature:
The following graphs shows the Pacific-Ocean temperature and salinity distribution across a meridian from 76° south to the North Pole:
This is down to 6000 meters: |
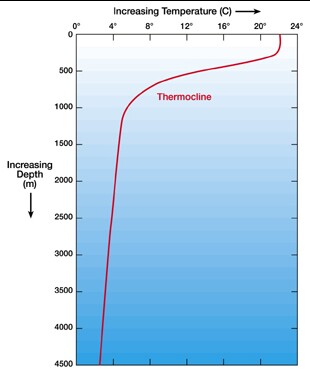
This is down to 1500 meters: Note the lower boundary of the thermocline at about 500 meters. |
 |
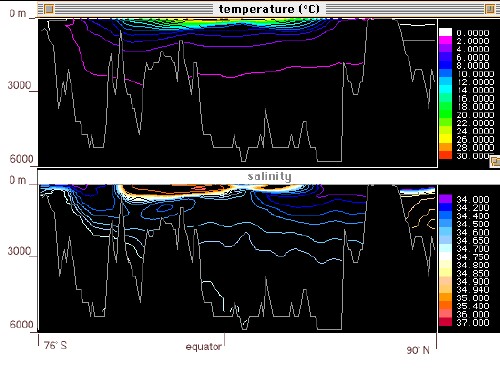
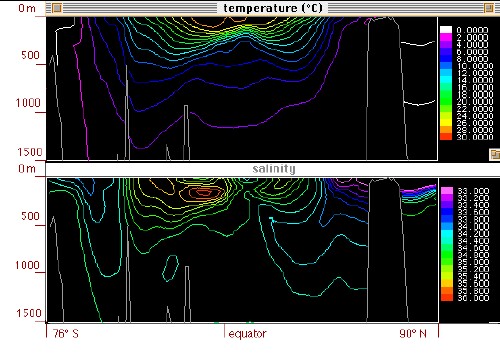 The time of year appears to be about winter in the northern hemisphere.
It has been shown that the wind speeds for tropical cyclones increase as ocean surface temperature increases.
The relative constant temperature with depth at the North Pole and South Pole enables high-density cold and salty water to sink there, which drives the Ocean Conveyor Belt:
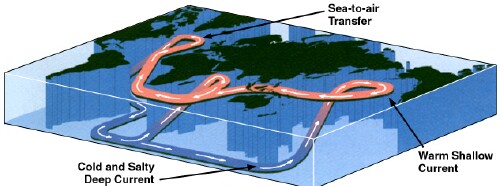 |
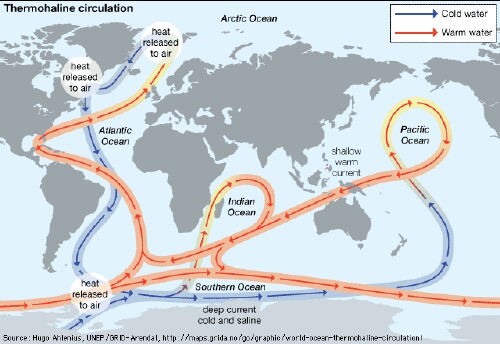 |
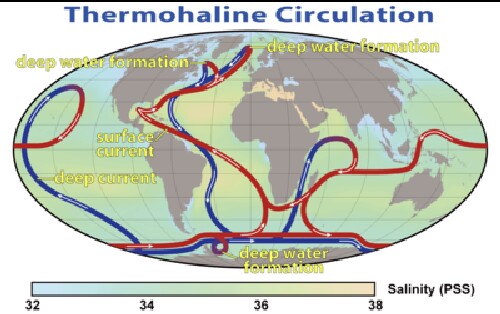
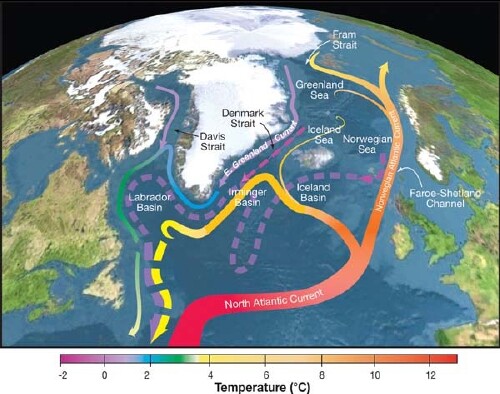

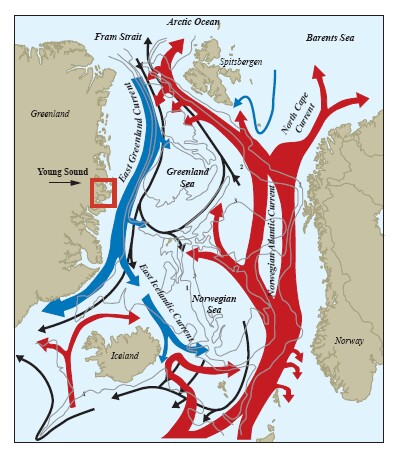
Global warming can disturb this ocean current by melting ice at the poles and thereby decreasing the salinity and, thus, disturbing the sinking. Also, warmer water at the poles carried there from the tropics disturbs the sinking.
Causes of Global Warming
Release of Carbon-dioxide into the Atmosphere by Burning Fossil Fuels
The five variable shown effect the temperature as follows:
The main greenhouse gas is carbon dioxide. Methane converts to carbon dioxide with a lifetime of about 12 years. There are at least two other variables that cause temperature change:
|
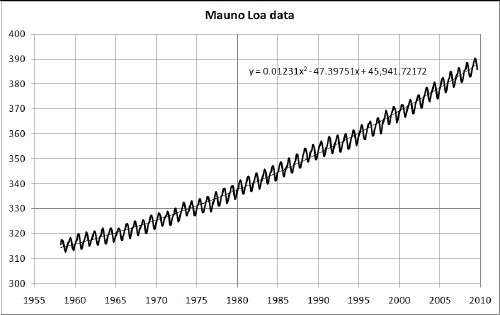
Atmospheric CO2 concentration (ppmv) measure at Mauno Loa, Hawaii.
|
 |
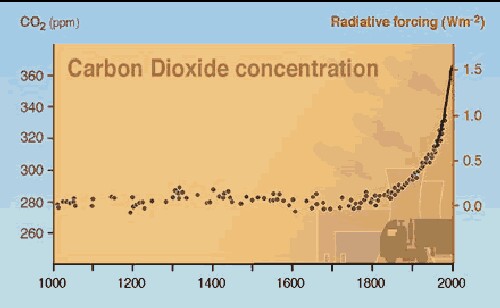
Atmospheric CO2 concentration for the last 1000 years:
|
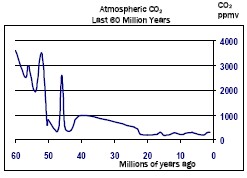
The Earth was very hot from 25 to 100 millions of years ago. |
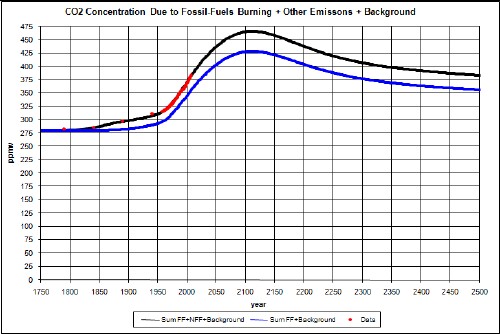
This graph shows an estimate of the atmospheric CO2 concentration due to burning fossil fuels and non-fossil-fuels emissions: 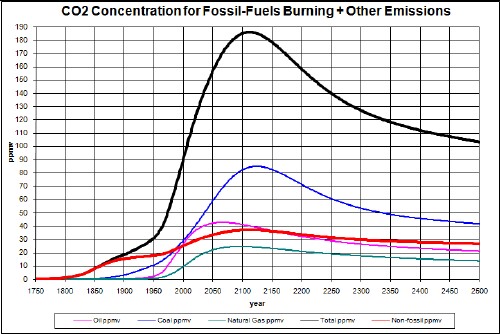 |
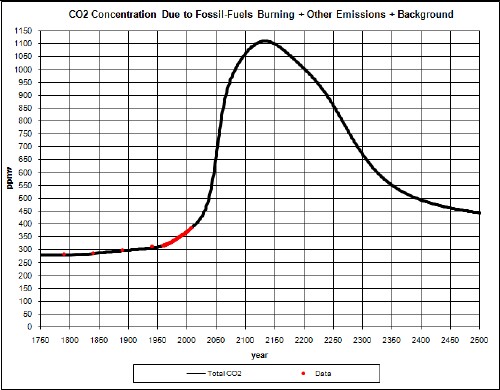
This graph shows an estimate of a "least case" total atmospheric CO2 concentration due to burning fossil fuels and non-fossil-fuels emissions plus a background of 275 ppmv before human intervention, with no saturation of CO2 sinks and no triggering of carbon emissions from the ground and oceans.
The blue curve is due to fossil fuels and the background only. The top curve includes all other causes of carbon dioxide emissions. |
This graph shows as estimate of a "worst case" total atmospheric CO2 concentration due to burning fossil fuels and non-fossil-fuels emissions plus a background of 275 ppmv before human intervention, with saturation of CO2 sinks and triggering of massive carbon emissions from the ground and ocean.
|
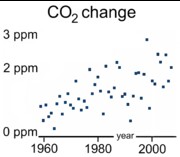
Some global-warming deniers have claimed that, since atmospheric CO2 concentration often lags average Earth temperature rise in past climate records, then atmospheric CO2 concentration does not cause temperature to rise. They do not allow for the fact that atmospheric CO2 concentration and average Earth temperature are mutually-positive-feedback variables. For the modern emissions of CO2 into the atmosphere, the atmospheric CO2 concentration leads average Earth temperature:
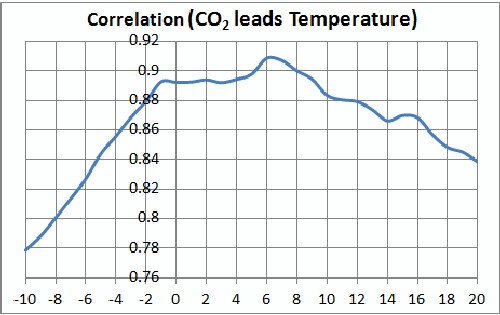
Note that the time lag is about six years.
Other Global-Warming Gases
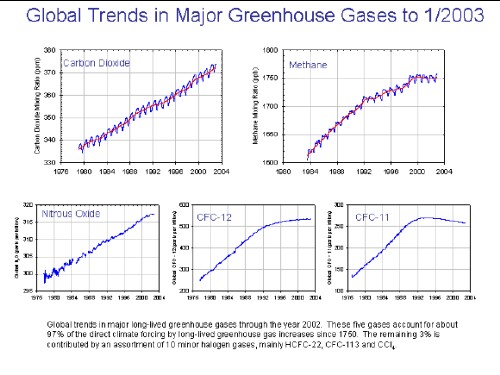
http://en.wikipedia.org/wiki/Greenhouse_gases: "Methane has an atmospheric lifetime of 12 ± 3 years and a Global-Warming-Potential of 72 over 20 years, 25 over 100 years and 7.6 over 500 years. The decrease in GWP at longer times is because methane is degraded to water and CO2 through chemical reactions in the atmosphere."
Deforestation
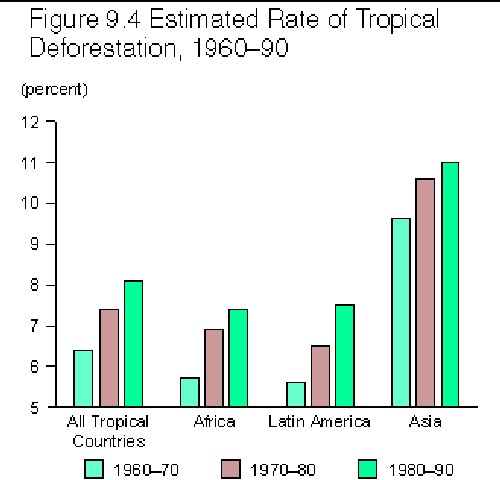
http://en.wikipedia.org/wiki/Deforestation: "...recent calculations suggest that carbon dioxide emissions from deforestation and forest degradation (excluding peat land emissions) contribute about 12% of total anthropogenic carbon dioxide emissions with a range from 6 to 17%."
Average Earth Temperature Due to burning fossil fuels and non-fossil-fuels emission
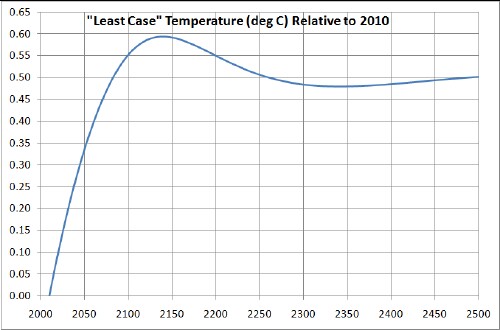
An estimate of the average Earth temperature for the "least case" total atmospheric CO2 concentration shown above, using a climate sensitivity of 3.
|
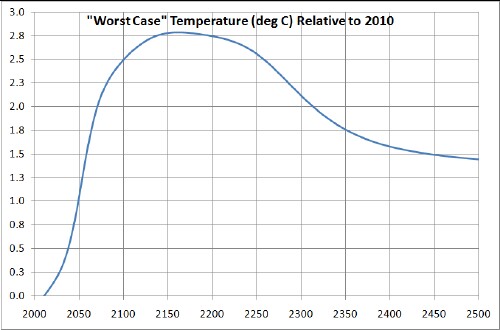
An estimate of the average Earth temperature for the "worst case" total atmospheric CO2 concentration shown above, using a climate sensitivity of 3.
Increasing the climate sensitivity to 4 will increase the temperature by about 1C at 2200 and by about 0.8C by 2500. |
Global Dimming
There are particulates that human activity and non-human events emit into the atmosphere that cause cooling rather than heating:
- Aerosols such as sulfur dioxide (from burning coal) (See graph above.)
- Dust
- Volcano eruptions (See graph above.)

This dust is due to the dry conditions during very cold periods with high winds sweeping off of ice packs. It also feedbacks to make the climate even colder.
Consequences of Global Warming
Sea-Level Rise Due to Increasing Temperature
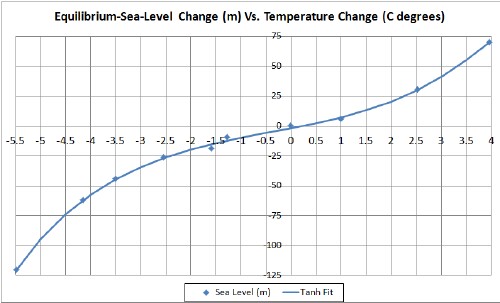
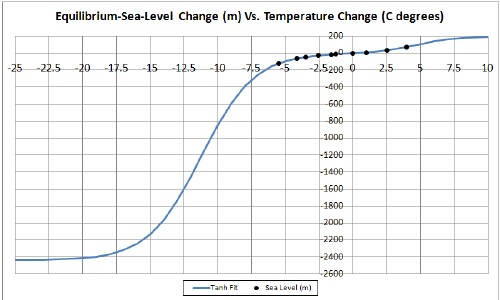
There are two different situations with regard to sea level rise due to increasing temperature:
- Long-term equilibrium sea-level rise, which can take hundreds of years to reach after temperature changes.
- Short-term sea-level rise.
 |
 |
The next graphs show estimates of short-term sea-level rise for a lag time of 262 years:
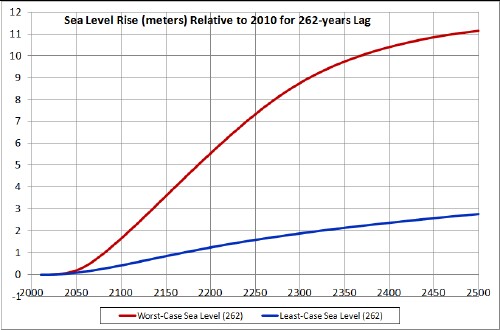 The two different cases are for two different scenarios of global warming. The two different cases are for two different scenarios of global warming. |
 |
 |
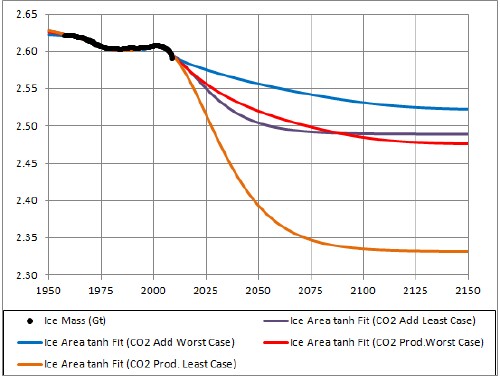
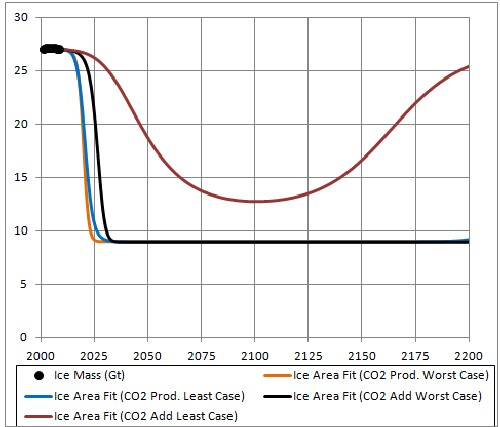
Ice Melting on Land and Sea
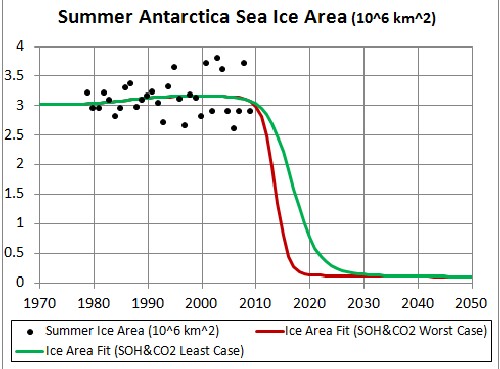
There are many ways to project the declining data for Earth ice masses into the future. Some of them are shown in the graphs below.
The flatness in the Antarctica-sea-ice data since 1980 are due to the huge ozone hole above Antarctica. |
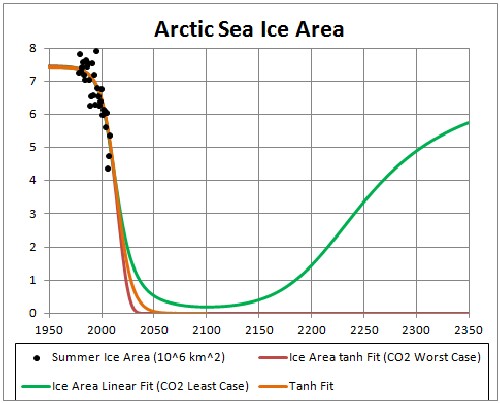
This does not include the Antarctic-sea-ice loss; for it see the graph above. |
A glacier with average thickness of 100 meters: 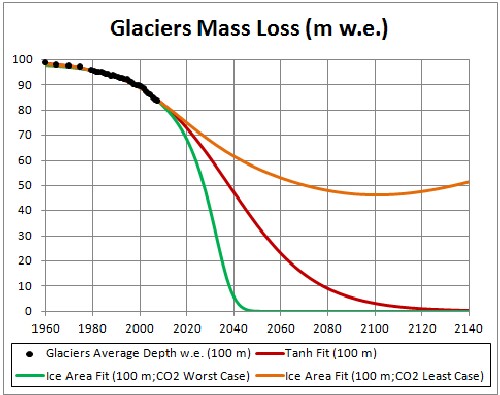 |
A glacier with average thickness of 1 meter: 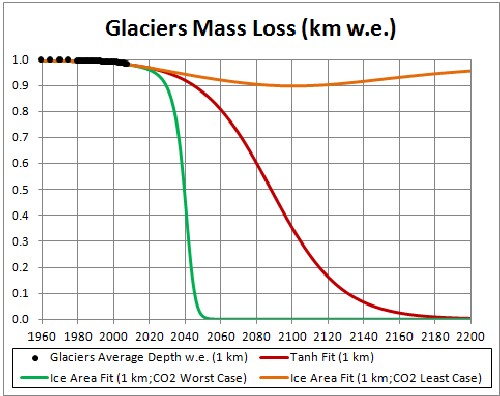 |
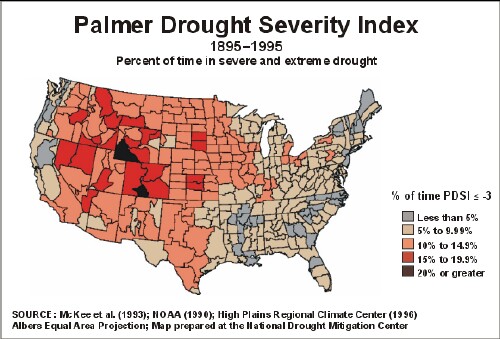
Droughts and Floods Due to Global Warming
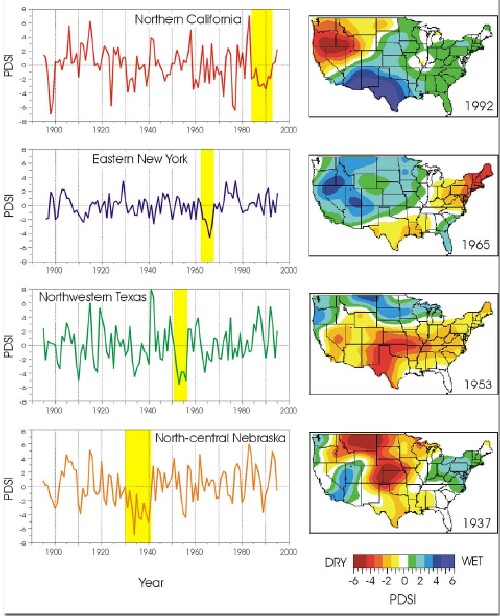 |
PDSI = Palmer Drought Severity Index. Severe droughts are marked yellow. -2 = moderate drought, -3 = severe drought, -4 = extreme drought. |
| A more recent index of droughts is the Standardized Precipitation Index (SPI). |
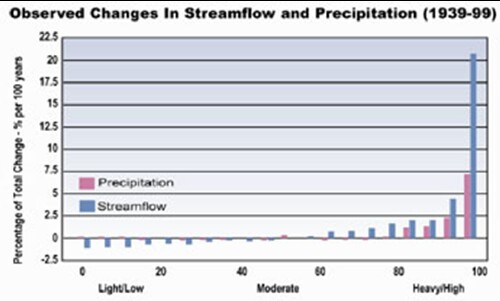
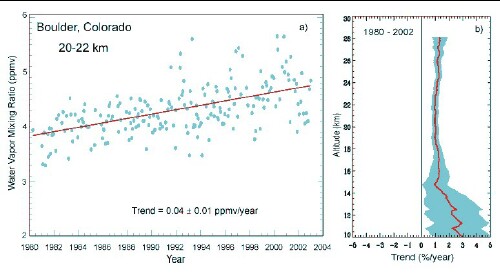
Floods will increase because higher temperatures put more moisture into the atmosphere:
Water vapor in the upper atmosphere is a potent greenhouse gas. Water vapor in the lower atmosphere causes increased precipitation, therefore floods. |
 |
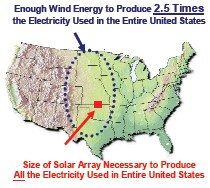
Renewable Energy
Global Warming Web Pages of L. David Roper
Global Warming Mathematics