L. David Roper
http://www.roperld.com/personal/roperldavid.htm
28 January, 2019
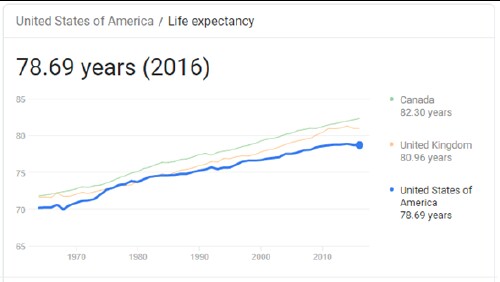
Some have predicted great increases in average life expectancy at birth in the United States over the next century. So, I decided to gather the data and see if one can mathematically project into the future. References for the data are given below.
Since I expect that life expectancy will start from some reasonably constant value and the transition to some new reasonably constant value, I use the function
![]() ,
,
where a = initial constant value, b = final constant value, t0 = mid-point of the transition and w = width of the transition.
The following graph shows the data used, a linear fit to the data versus time (equation of linear fit is shown) and the tanh fit to the data:
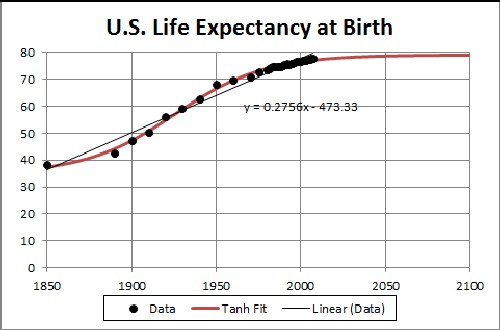
The chi-square for the tanh fit to 38 data points is 14. The parameters of the fit are:
a |
b |
t0 |
w |
35.0 |
79.1 |
1925.4 |
53.3 |
Obviously, the tanh fit is much better than a linear fit. The asymptotic life expectancy at birth is 79.1 years, far from immortality as some claim will happen.
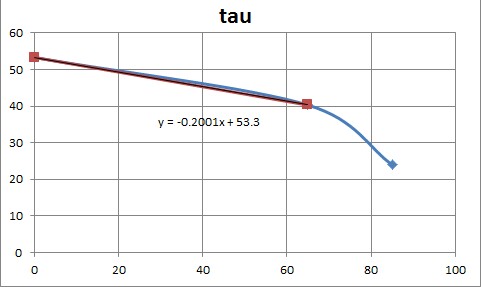
It is instructive to look at the life-expectancy-at-birth change for the tanh fit:
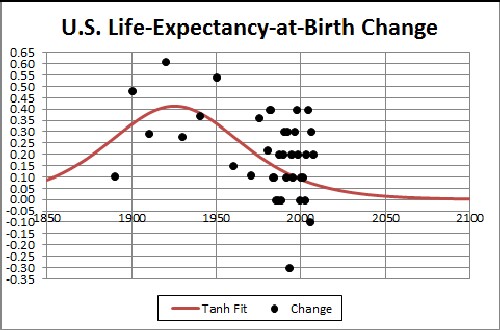
The equation for the curve is  .
.
The change peaked at about year 1925 at the value of ~0.41 years per year.
Of course, life expectancy decreases as one's age increases. The following graph is a fit of a tanh to the data for 1996:
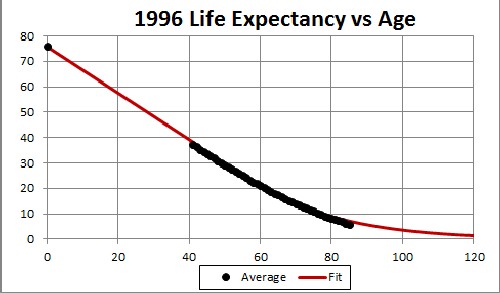
The parameters of the fit are: a = 89.3, b = 0, t0 = 35.2 and w = 40.8.
The a = 89.3 is a fictitious number for ages less than 0!
The oldest person known to have lived was 122 years and 164 days old at death.
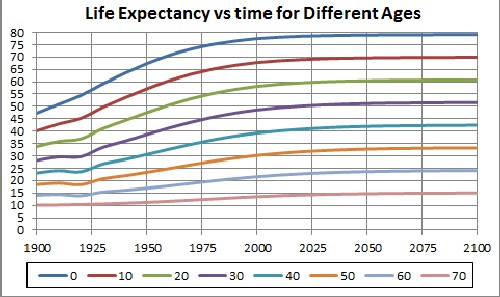
Fits to the life-expectancy versus time for different ages are:
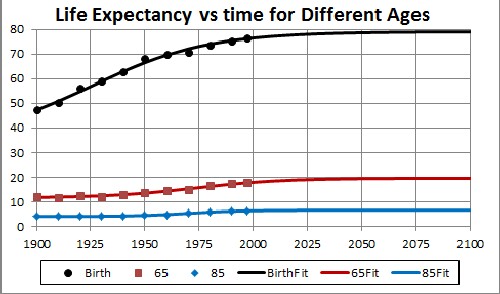
The parameters of the fits are:
| Age | a |
b |
t0 |
w |
0: |
35.0 |
79.1 |
1925.4 |
53.3 |
65: |
11.6 |
19.6 |
1972.8 |
40.3 |
85: |
4.1 |
6.6 |
2970 |
23.9 |
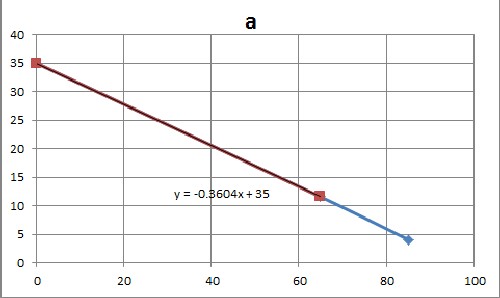
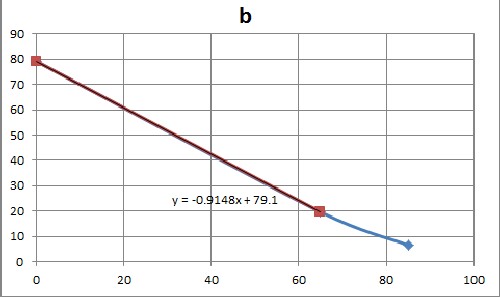
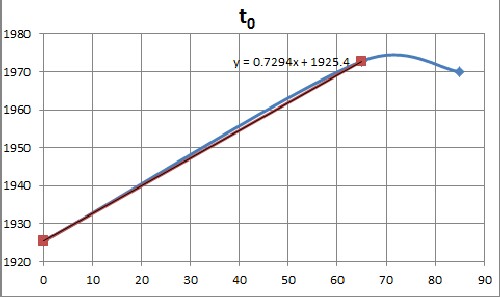
Plots of these parameters versus age show that they are approximately linear up to about 70 years:
 |
 |
 |
 |
The equations for the linear fits to the first two ages (0=birth & 65) are shown in the graphs.
Using those four linear equations, the life expectancy for ages separated by 10 years up to 70 years are:
Since Japan has the highest life expectancy, it is of interest to compare the life expectancy in the United States to life expectancy in Japan:
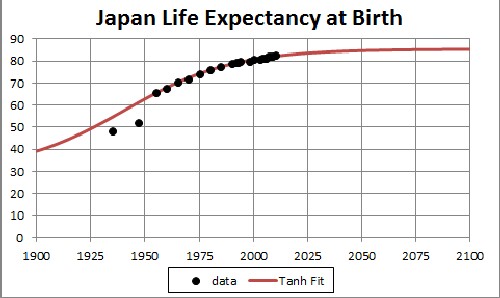
The earliest two data were not included in the fit. The final life exectancy is ~85 years, 6 years higher than for the United States. There are undoubtedly many reasons for this difference, but probably the overarching reason is that the Japanese society is much more cooperative and much less individualistic than is the United-States society.
Using data from http://www.infoplease.com/world/statistics/life-expectancy-country.html the following graph was created for a selected set:
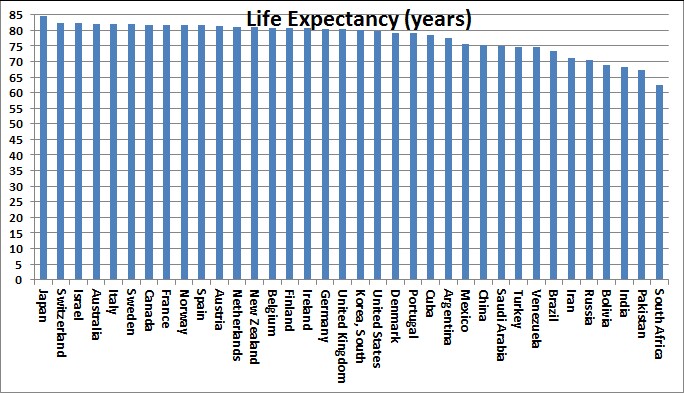
The U.S. is quite far down the list.
The average life expectancy at birth in the United States is headed toward an asymptote of about 79.1 years. The average change peaked at about year 1925.
The major flaws in this study are:
L. David Roper, http://www.roperld.com/personal/roperldavid.htm; roperld@vt.edu
L. David Roper interdisciplinary studies