L. David Roper
http://www.roperld.com/personal/roperldavid.htm
6 April, 2016
One can visualize stock-market data as due to many entities changing from a state to a new state. The entities could be individual large companies, a collection of several companies or some social event that effects the stock market.
The hyperbolic tangent is a function that can represent a state changing from one value to another:
![]() ,
,
where a = the initial value and b = the final value.
In this ariticle I assume that the fluctuations in the Standard & Poor's collection of stock-market monthly values for 500 companies can be represented by a sum of hyperbolic tangents.
The values for the four parameters for each hyperbolic tangents are chosen by fitting the sum of the hyperbolic tangents to the S&P monthly data. As shown in the equation, there are effectively 3N+1 parameters (A, Bn, tn0 and wn) to be varied.
The fits are started by spacing the N tn0 parameters evenly over the time interval chosen (years 2000 to 2005), setting the N wn parameters to 0.1 and setting the N an and N bn parameters to 0. The an and bn parameters are varied first, which gives a fairly-good rough fit to the data. Then the wn parameters are varied. Finally, the tn0 parameters are varied along with all the other parameters.
A fairly good rough fit to the selected data can be obtained with 10 hyperbolic tangents:
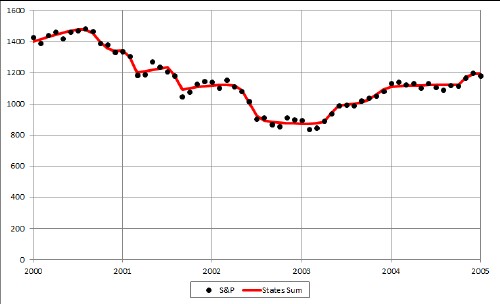
The fit's 31 parameters are:
A: |
2107.634 |
||
n |
Bn |
tn0 |
wn |
1 |
673.8926 |
2000.079 |
2.000769 |
2 |
-217.276 |
2000.735 |
0.123872 |
3 |
-164.828 |
2001.086 |
0.006556 |
4 |
-159.332 |
2001.584 |
0.001159 |
5 |
-229.847 |
2002.412 |
0.09504 |
6 |
-80.2477 |
2002.561 |
0.391414 |
7 |
119.4316 |
2003.329 |
0.068235 |
8 |
110.7986 |
2003.832 |
0.127105 |
9 |
65.9784 |
2004.82 |
0.028471 |
10 |
-163.556 |
2005 |
8.23E-11 |
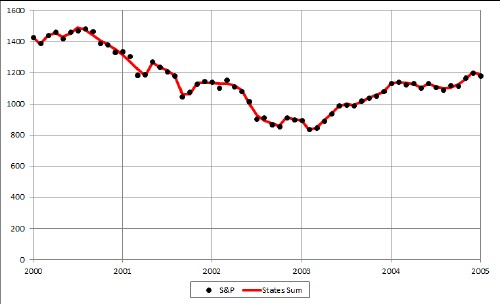
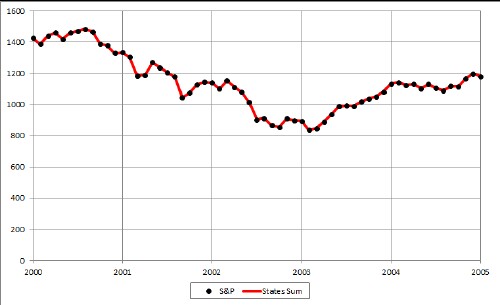
Much better fits can be obtained with 25, 50 and 100 hyperbolic tangents.
This N=25 fit has 76 parameters. |
This N=50 fit has 151 parameters |
This N=100 fit has 301 parameters. |
The N=50 fit is as good as the N=100 fit.
I have shown that the Standard and Poor stock-market data for the years 2000 to 2005 can be fitted well with a sum of hyperbolic tangent functions. One can think of these functions as representing states changing from one value to another.
It would be interesting to try to connect these states' changes to some known states' changes.
There is no predictive value in these fits. They merely show that one can visualize the Standard and Poor stock-market data as states' changes.
L. David Roper interdisciplinary studies
Roper Global Warming
L. David Roper, http://www.roperld.com/personal/roperldavid.htm
6 April, 2016
c:/science/meteorology/tornados.xlsx