L. David Roper
http://www.roperld.com/personal/RoperLDavid.htm
5 March, 2018
World Fossil Fuels Depletion
The technique of fractionating ("fracking") shale/dolomite formations. A "boom" in nonrenewable resource extraction from the Earth is defined as a time period in which extraction is occurring very fast in a given area; thus, many workers come in from outside the area to man the drilling rigs, to build housing for the oil workers and to provide other services for the increased population.
This article shows mathematically that the current Colorado crude-oil boom will become a bust within a decade. A "bust" in nonrenewable resource extraction from the Earth is defined to begin at the time when extraction of the resource peaks and then falls to negligible amounts over a time period.
The U.S. Energy Information Administration gives monthly and annual crude-oil extraction data for Colorado since 1981. Earlier data are available back to 1940.
Those data are fitted by a extraction function, the Verhulst function, in this study to determine when the extraction will peak.
The data and the fits to the data are given in a later section.
A reliable estimate of reserves is needed to fit extraction data by a function for projecting into the future for a nonrenewable resource Here is a good definition of reserves of a nonrenewable resource.
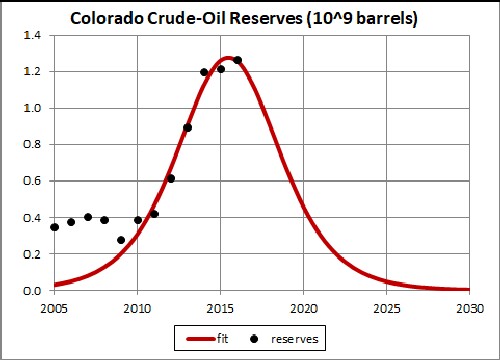
The U.S. Energy Information Administration gives reserves estimates from 2006 to 2011 for crude-oil extraction in Colorado , which are shown here by black dots for years 2005 to 2014:
The curve is a fit to the 2010-2016 reserves estimates using the Verhulst function described in the next section, assuming that the curve will be symmetrical. The fit is done to get the peak value of the reserves estimate, which is ~1.3 x 10⁹ barrels.
The depletion function that is used in this article is the Verhulst function:
The asymmetry parameter, n, must be greater than 0.
where 
The maximum of P(t) occurs at ![]() , which yields the peak value
, which yields the peak value ![]() .
.
For the symmetric case (n=1): ![]() and
and ![]() .
.
For a depletion situation for which there are N peaks the depletion function is:
 .
.
When a peak is symmetrical, the Verhulst function simplifies to
 .
.
The fit to the extraction data using the reserves peak value, ~3.6 x 10⁹ barrels, almost 3 times as large as the value given above :
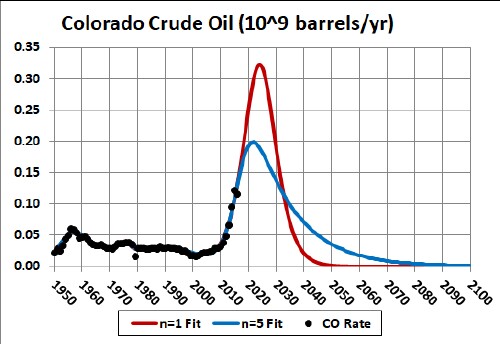
The final large peak in the red curve is assumed to be symmetric. Asymmetry would shift the peak backward for n > 1 (depletion curve skewed forward with a smaller peak) and forward for n < 1 (depletion curve skewed backward with a larger peak). The blue curve is for n=5, a value that is close to what J. David Hughes finds in his detailed micro-analysis of extraction of tight oil by fracking in the U.S.
The area under the curve is equal to the amount already extracted (~2.5 x 10⁹ barrels) plus the reserves value (~3.6 x 10⁹ barrels).
If this very high reserves value (~3.6 x 10⁹ barrels) is correct, the final peak occurs at year ~2024 for n=1 and ~2022 for n=5. The onset of the bust could be extended out to later years by imposing environmental regulations and/or taxes on the extraction of natural gas, thereby reducing the extraction rate.
L. David Roper interdisciplinary studies
World Fossil Fuels Depletion
L. David Roper, http://arts.bev.net/RoperLDavid/
5 March, 2018