Early in the history of fossil-fuels extraction the energy available in the minerals extracted was high. However, as the more-easily extractable minerals are no longer available the energy return over energy invested (EROEI) decreases. Eventually, the EROEI goes to zero, at which point extraction no longer occurs for the purposes of using it for energy. Of course, it still may be extracted for its material value until solar materials replace it.
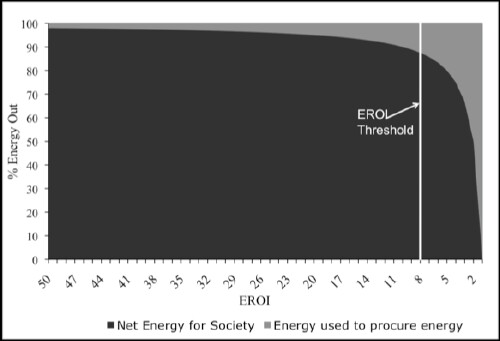
An excellent article about the mathematics of an EROEI threshold (< ~8 ) has the following graph:
The equation is % net energy = (EROEI-1)/EROEI.
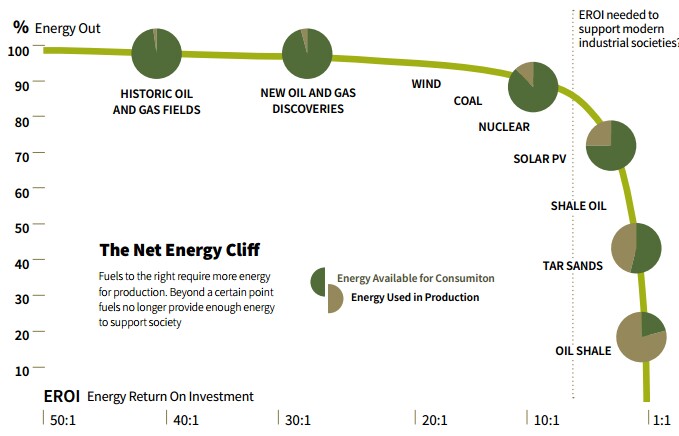
The point of the graph is that the fraction of useable energy falls very rapidly as the EROEI goes below 8.
Reference 3 gives the following approximate values for EROEI for world crude oil:
I fitted a hyperbolic tangent to these "data":
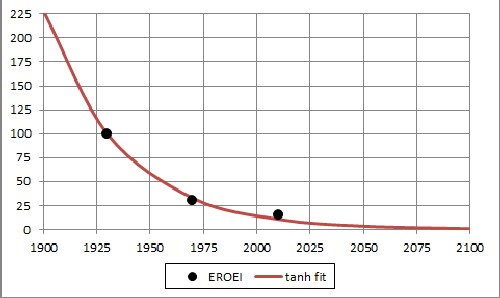
The fit equation is 39284{1-tanh[(t-1715)/72.01]}/2.
Because of the poor fit to the most recent datum, a fit was done only to the last two data:
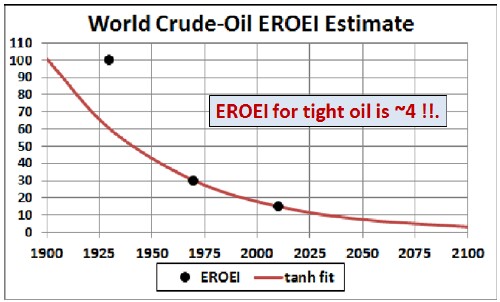
The fit equation is 35419{1-tanh[(t-1562)/115.35]}/2.
To get the amount of energy available from extracted crude oil for the world multiply the conventional-crude-oil extraction rate multiplied by this function plus 4 x the supposed tight-oil extraction:
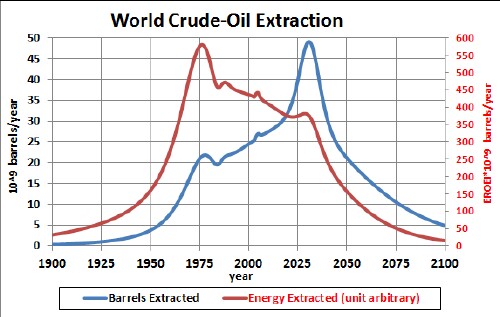
The blue curve shows the extraction rate in 10^9 barrels per year, with a projected peak at about 2030. The red curve shows the approximate energy (in arbitrary unit) available from the extracted crude oil, which hardly peaks at all.at year 2030!. At whatever year tight-oil extraction peaks, its corresponding energy peak will be very small!
Applying the same EROEI function to the crude-oil extraction data for the United States:
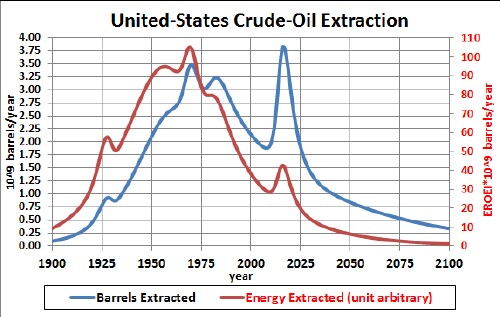
Although the extraction peak occurred at ~1970 with a projected later peak at ~2020, the energy availability peak was at ~1970. At whatever year tight-oil extraction peaks, its corresponding energy peak will be very small!
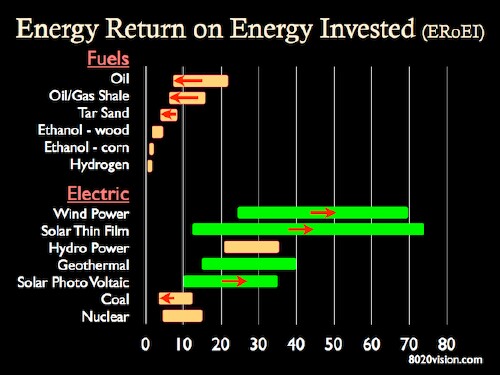
The EROEI for tar-sands oil and tight-oil is ~4. Oil extracted from Canadian oil sands is a blip on world extraction, but the energy blip is much smaller; essentially negligible. Oil extracted coal will be even less important for future energy.
Charles Hall and David Murphy give a curve for estimated EROEI at the city gate. I have fitted a function containing three hyperbolic-tangent functions to their curve:
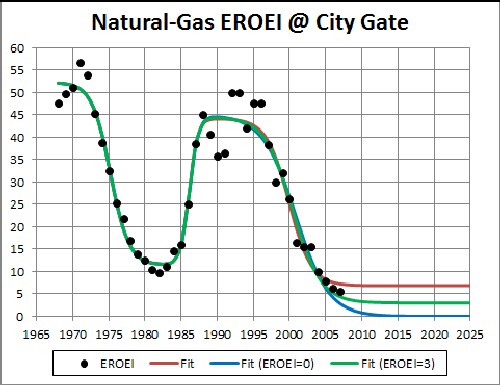
The best fit gave a final EROEI of 6.87. However, more data are needed to determine that number. So, I have also included two other options, final EROEI=0 and final EROEI=3.
Applying the best-fitEROEI for world natural gas, including shale gas, to the fit to the world extraction data we get:
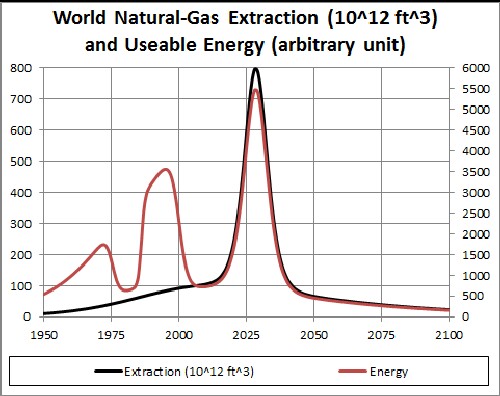
The left axis is for the black extraction curve and the right axis is for the red energy curve. Of course, the energy available at the city gates is very sensitive to the final EROEI.
Applying the best-fitEROEI for world natural gas, including shale gas, to the fit to the U.S. extraction data we get:
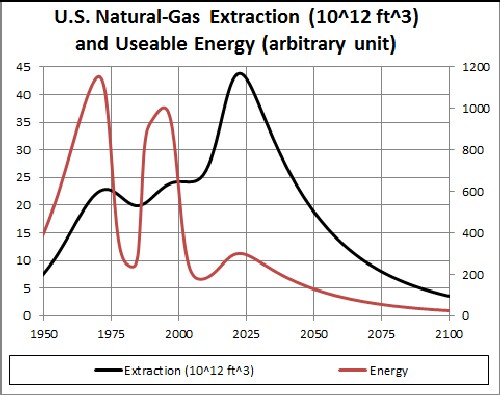
The left axis is for the black extraction curve and the right axis is for the red energy curve. Of course, the energy available at the city gates is very sensitive to the final EROEI. Although shale gas has a huge extraction peak the usable energy due to shale gas has a small peak.
Energy return on energy investment at the coal mine mouth has been estimated at 80 for the ~1955 and 30 for the ~1975. Since EROEI declines exponentially, fitting an exponential to these two values yields the curve
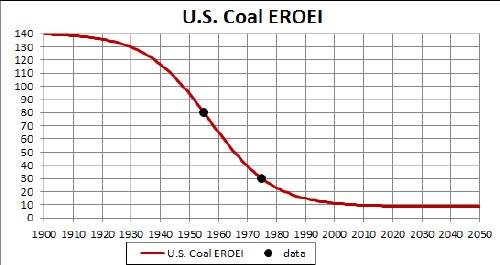
The fit equation is [148.92-131.79*tanh{(t-1956.9)/22.132}]/2.
Of course, more energy is required to move the coal from the mine mouth to the power plants where it is burned to produce electricity and much energy is lost burning it, which is neglected here. So, the calculation presented below is very optimistic.
Mutiplying this curve times the U.S. coal extraction-rate yields
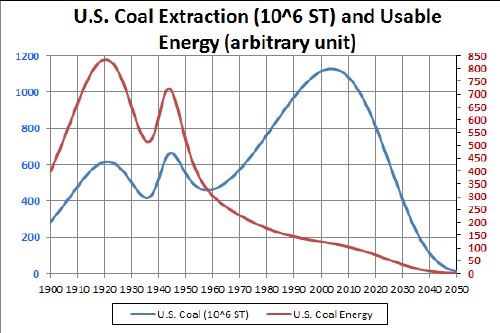
Thus, even though the extraction rate has been rising since 1960 the energy due to burning coal has decreased over that time period, having peaked ~1920 and again in ~1943.
The rough calculations including energy return on energy invested (EROEI) yield the following conclusions:
The estimates of the EROEI used here are crude. If any reader has better estimates, please send them to the author (roperld@vt.edu) so that similar calculations can be done with them.
L. David Roper, http://arts.bev.net/RoperLDavid/; roperld@vt.edu
11-jun-17