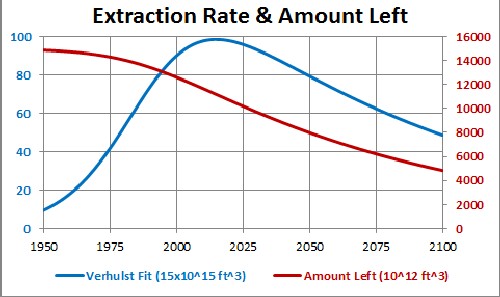
The blue curve is the extraction-rate prediction. Note that, on the average, peak gas will occur at about 2015.
L. David Roper
http://www.roperld.com/personal/RoperLDavid.htm
02-Jul-2016
It seems reasonable that the price of a non-renewable mineral will be an inverse power function of the amount left to be extracted (Q). I did such a fit to the price of natural-gas since 1978 as shown below.
The amount of crude oil left to be extracted as a function of time, Q, for my best fit to the World extraction data & the discovery rate is given by the red curve here:
The blue curve is the extraction-rate prediction. Note that, on the average, peak gas will occur at about 2015.
The average price ($/106 ft3 )data fitted by a inverse power function of Q:
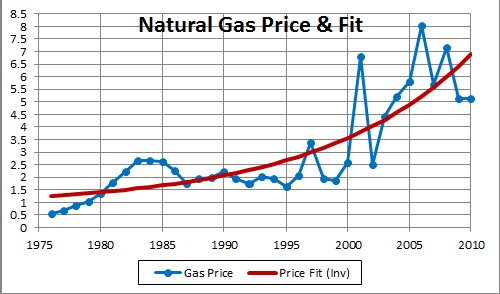
The equation of the curve is P = (2.01x1035)/Q8.47.
The prediction of the inverse-function fit for years up to 2020 is:
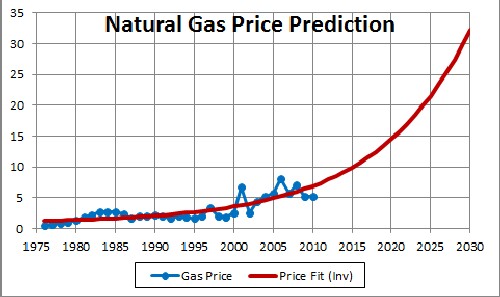
I expect that there will be fluctuations around the average curve, especially as panic sets in.
Each year as the last year's price is known, I can refit the curve to get a better prediction for future years.
Probably when world natural-gas extraction falls to about 1/2 of its peak, it will be realized by the market that we have to wean ourselves from oil. Renewable sources of energy and petroleum-like chemicals will replace oil. A possible scenario might be:
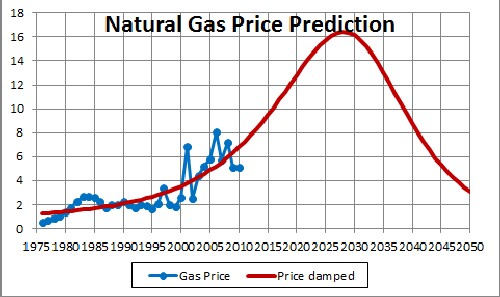
Such damping may also be influenced by the increase of electric transportation.
This curve was obtained by multiplying the function above by [1+tanh({t-2030}/10)]/2. I call this damping of natural-gas prices.
Minerals Depletion
Correlations of Energy-Minerals Prices and Consumer Energy Prices
L. David Roper, http://arts.bev.net/RoperLDavid/; roperld@vt.edu