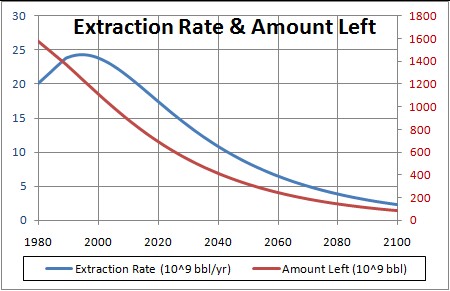
The blue curve is the extraction-rate prediction. Note that, on the average, peak oil occurred at about 1995.
L. David Roper
http://www.roperld.com/personal/RoperLDavid.htm
02-Jul-2016
An interesting analysis of the effect of oil prices on financial markets. This paper inspired me to look at oil prices in a different way: It seems reasonable that the price of a non-renewable mineral will be an inverse power function of the amount left to be extracted (Q). I did such a fit to the price of crude oil in the first week of January since 1978 as shown below.
The amount of crude oil left to be extracted as a function of time, Q, for my best fit to the World extraction data & the discovery rate is given by the red curve here:
The blue curve is the extraction-rate prediction. Note that, on the average, peak oil occurred at about 1995.
The average price data for the first week in January fitted by a inverse power function of Q:
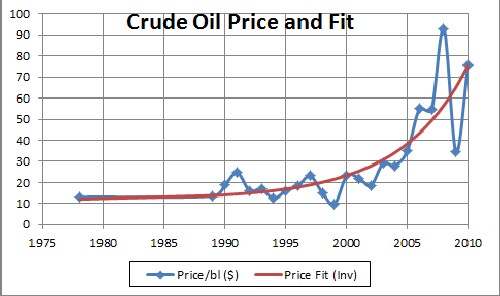
The equation of the curve is P = 11.4 + (3.82x10²³)/Q7.39.
The prediction of the inverse-function fit for years up to 2020 is:
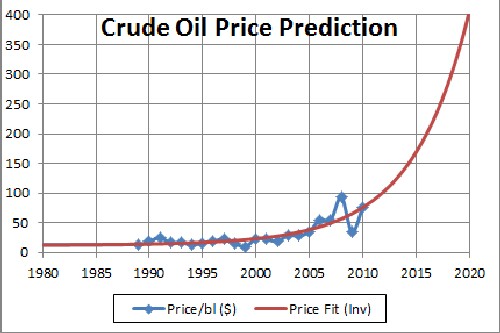
I expect that there will be fluctuations around the average curve, especially as panic sets in. For example, the price on 1 June 2009 was $126 and later that month it went as high as $140 or so. However, the price on 1 January 2009 was $93, which is the price used in this fit.
The prices fitted (blue dots in data above) are yearly 1 January prices, so the fit only predicts prices for 1 January. You need to wait until the end of a year to get points to compare to the fit. (Since the price has been level at about $70 for the last several months, I assumed a price for 1 January 2010 of $70. Each year as the 1 January price is known, I can refit the curve to get a better prediction for future years.
Probably when world crude-oil extraction falls to about 1/2 of its peak, it will be realized by the market that we have to wean ourselves from oil. Renewable sources of energy and petroleum-like chemicals will replace oil. A possible scenario might be:
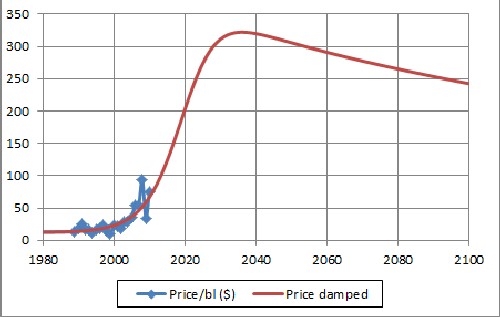
Such damping may also be influenced by the increase of electric transportation.
This curve was obtained by multiplying the function above by [1+tanh({t-2020}/10)]/2.
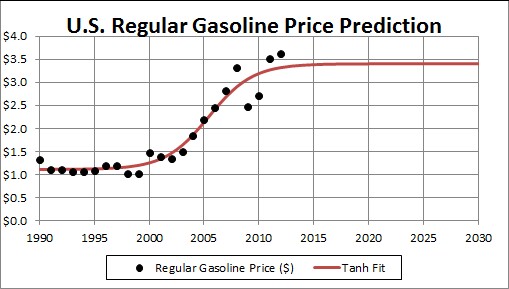
Another way to fit crude-oil prices is by an exponential and a hyperbolic tangent:
This fit is to data from 1995 onward.
This second way of fitting, relying on data with little theory, is more encouraging that the first way of fitting.
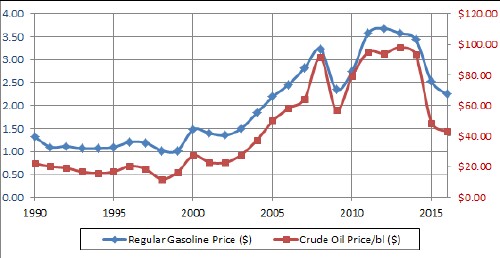
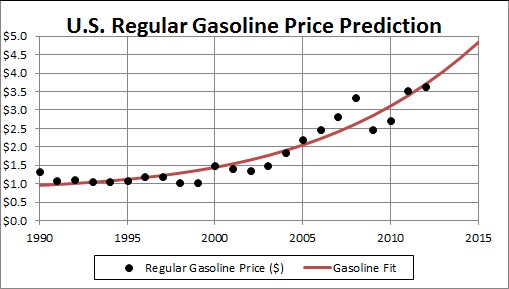
This result can be used to predict the future price of gasoline in the United States; it should be some power function of the price per barrel of crude oil. Here are those two prices:
A fit of the U.S. regular gasoline price (P) to the fit to crude-oil price (O) obtained above yields the power function
P =-0.011 + 0.22 O0.58:
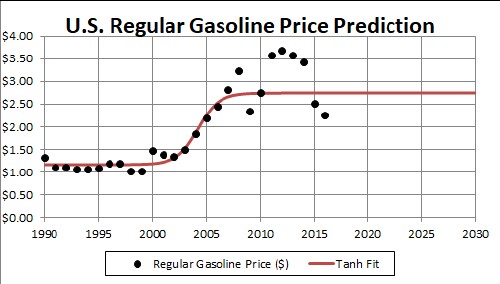
The predicted U.S. regular gasoline price to 2020 is:
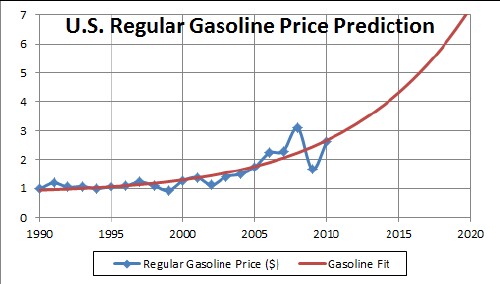
As more prices come in for future years, this fit can be done again to increase the accuracy of the predictions.
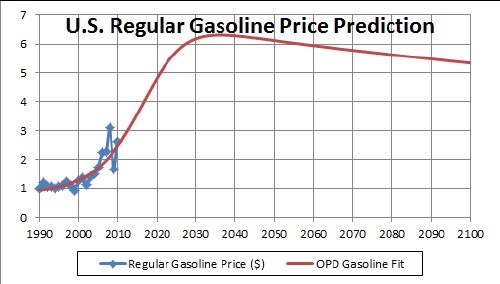
If the damping of crude-oil prices occurs as in the fourth graph above, the gasoline price might be similarly damped::
Another way to fit crude-oil prices is by an exponential and a hyperbolic tangent:
This second way of fitting, relying on data with little theory, is more encouraging that the first way of fitting.
See the book $20 Per Gallon: How the Inevitable Rise in the Price of Gasoline Will Change Our Lives for the Better by Christopher Steiner
The web page http://www.wtrg.com/daily/clfclose.gif is a good place to keep track of changing crude-oil prices:
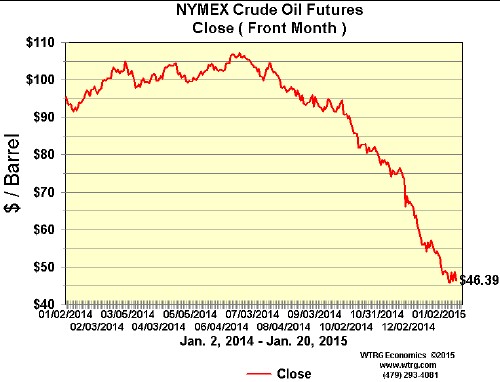
Crude-oil prices on 20 January 2015.
This huge drop in the price of crude oil is causing many U.S. oil companies to become bankrupt:
L. David Roper, http://arts.bev.net/RoperLDavid/; roperld@vt.edu