|
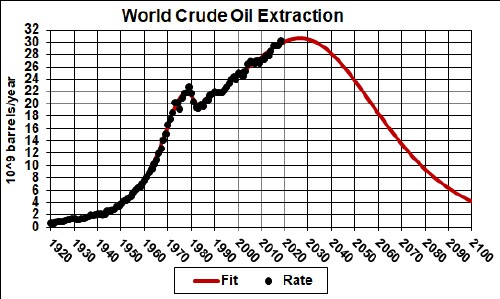
World crude-oil extraction rate and a Verhulst-function fit to the data obtained by fitting the discoveries data and the extraction data together with a common value for the amount to discovered and extracted. That value searched to 1.965x10¹² barrels.
|
|
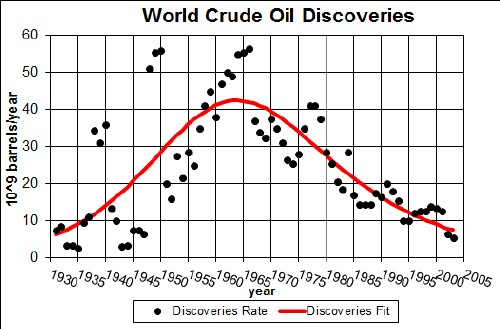
Comparison of world oil discoveries and extraction.
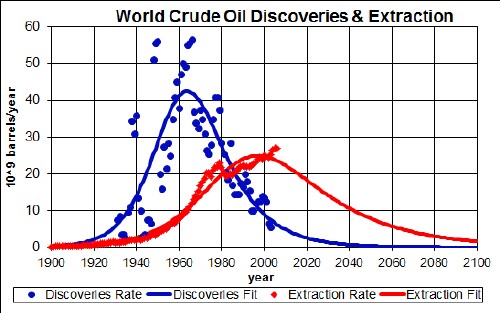
The amount under both curves is about 2x10¹² barrels.
This graph contains information that probably will have the greatest effect on those now living and born in the future. Crude Oil cannot be extracted if it has not been discovered! This graph shows very clearly why it is very unlikely that the final amount to be extracted will exceed 2x10¹² barrels. So far the amount extracted has exceeded 1x10¹² barrels, so we are more than halfway there!
|
Monthly world oil extraction.
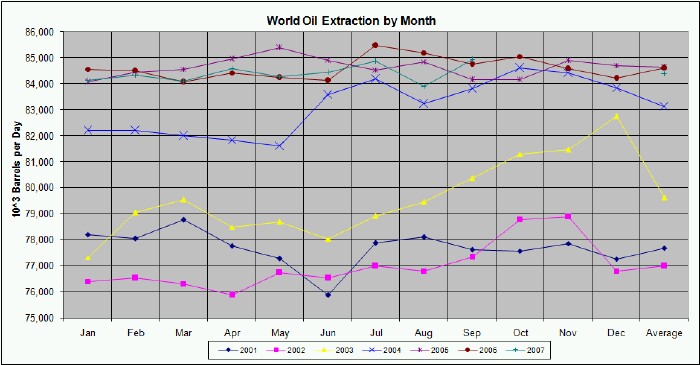
The amount extracted per month has been nearly level for three years.
|
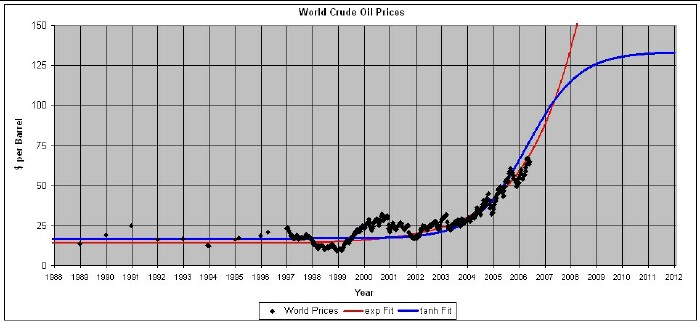
World crude-oil prices
Possibly a better way to project future crude-oil prices is to fit the product of the past prices and the past extraction rate, which yields a world total cost in dollars for crude oil for each year. Neglecting inflation (which could be accounted for by an inflation index as a function of time), it is reasonable to assume that there is a maximum total value, represented by dollars, that the world will assign to crude oil as it becomes depleted. That is, a hyperbolic-tangent function fit to the product might be a reasonable projection to the product. The following graph shows such a fit:
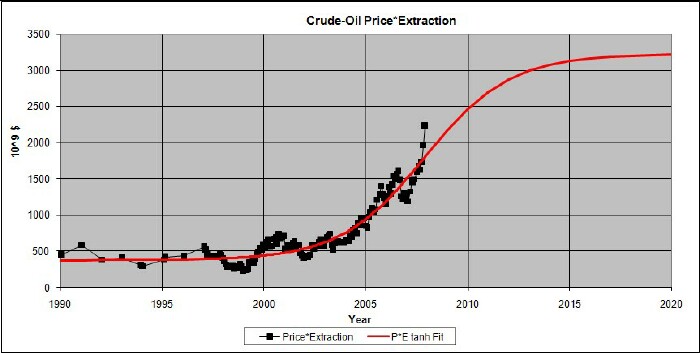
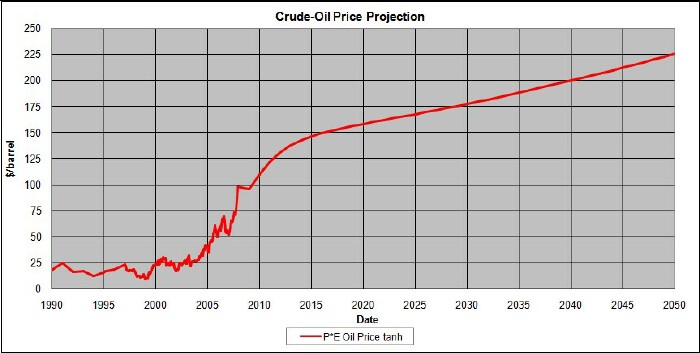
Using the projection of world crude-oil extraction into the future, and the fit in the graph above of the product of price times extraction rate, the projected price of crude oil is:
Another way to project future crude-oil prices is to fit the product of the past prices and the past extraction rate and divide by the population for each year, which yields a world cost in dollars per person for crude oil for each year. Neglecting inflation (which could be accounted for by an inflation index as a function of time), it is reasonable to assume that there is a maximum total value, represented by dollars, that the average person inthe world will assign to crude oil as it becomes depleted. That is, a hyperbolic-tangent function fit to the product/quotient might be a reasonable projection to the product. The following graph shows such a fit:
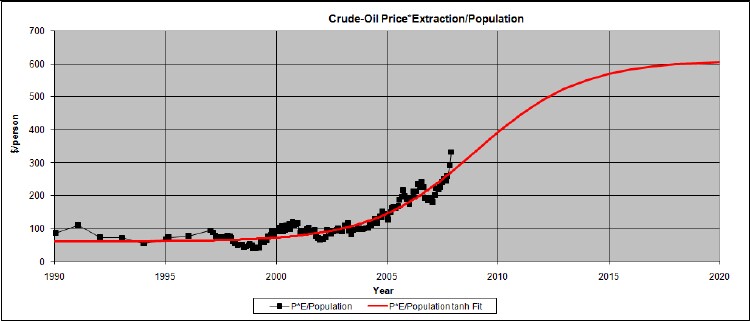
Using the projection of world crude-oil extraction into the future, the projected world population, and the fit in the graph above of the product of price times extraction rate divided by the population, the projected price of crude oil is the blue curve in the following graph.:
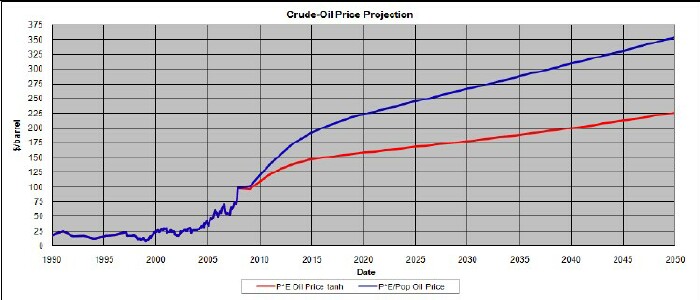
The red curve is the same curve as in the third graph above.
|
|
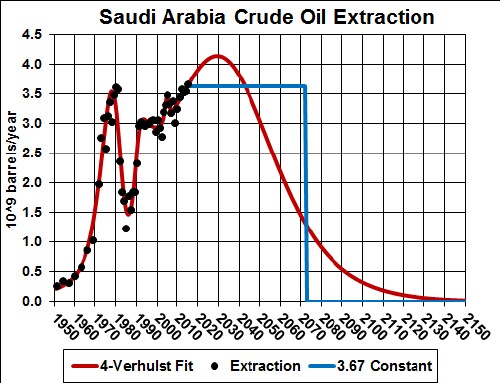
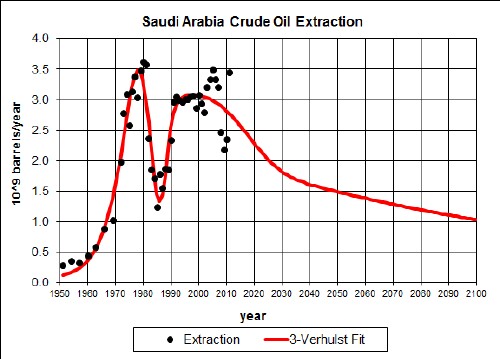
Saudi Arabia crude-oil extraction extrapolated to the year 2100:
 |
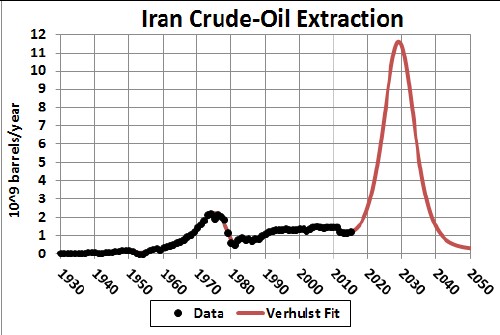
Iran crude-oil extraction
The total amount to be extracted is set at about 190x109 barrels, which is the reserves given by http://www.scaruffi.com/politics/oil.html plus the amount already extracted.
|
Iran crude-oil extraction extrapolated to the year 2100: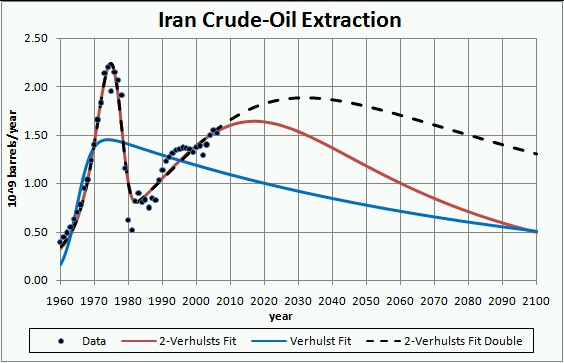
|
|
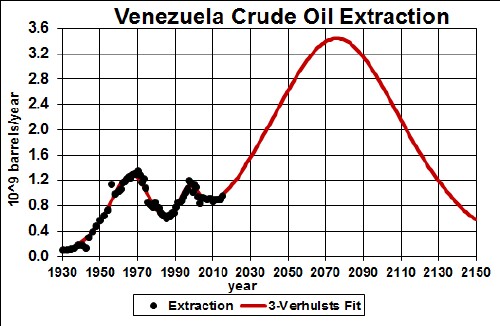
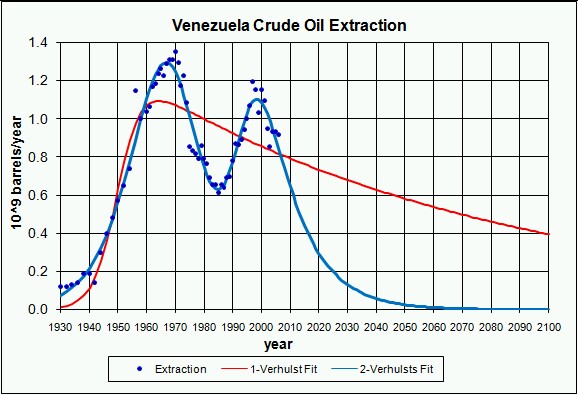
Venezuela crude-oil extraction extrapolated to the year 2100:
 |
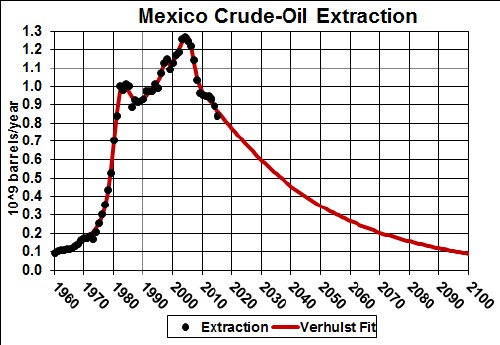
Mexico crude-oil extraction.
The total amount to be extracted searched to 60x109 barrels, which is very close to the amount given by http://www.scaruffi.com/politics/oil.html plus the amount already extracted.
|
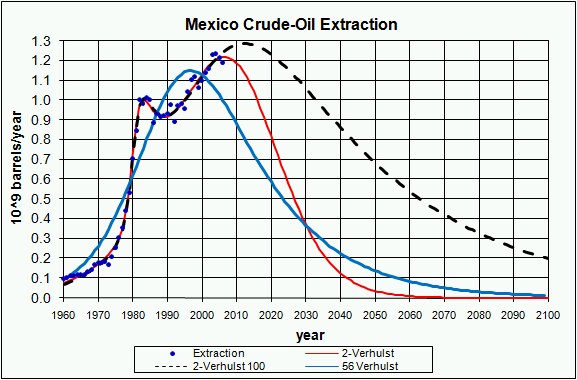
Mexico crude-oil extraction extrapolated to the year 2100:
 |
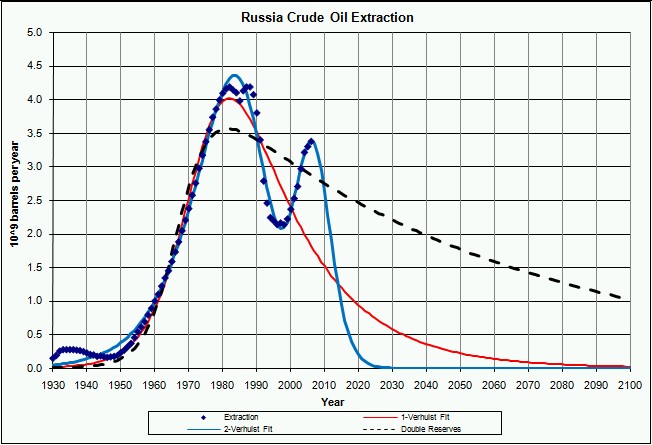
Soviet-Union/Russia crude-oil extraction.
The total amount to be extracted searched 504x109 barrels, which is more than the amount given by http://www.scaruffi.com/politics/oil.html plus the amount already extracted (430x109 barrels)
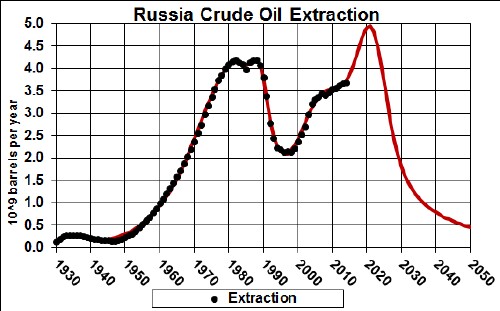
Note the drastic drop when the Soviet Union collapsed.
|
Soviet-Union/Russia crude-oil extraction extrapolated to the year 2100:
 |
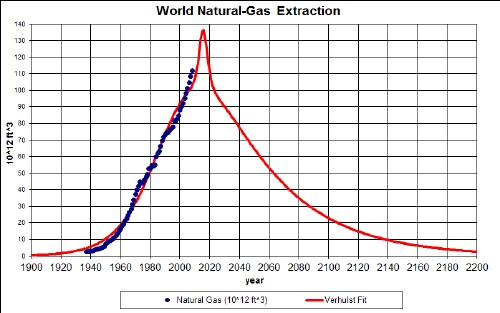
World Natural-Gas Extraction
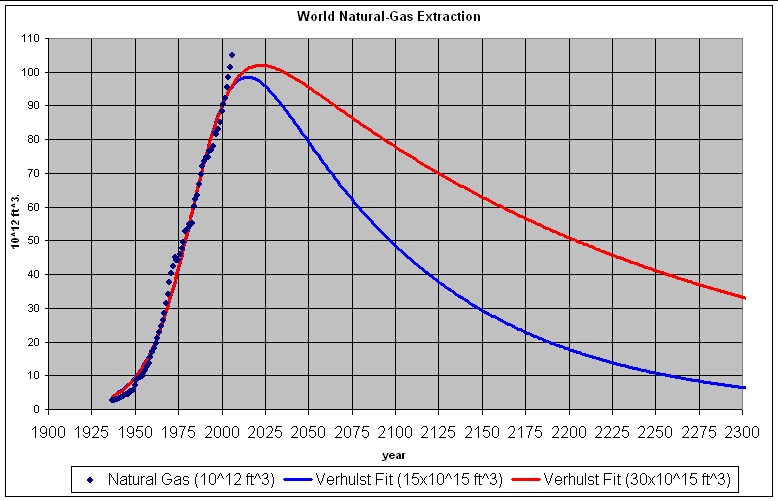
The blue curve corresponds to known resources. The red curve doubles the known resources.
|
World Natural-Gas Discoveries:
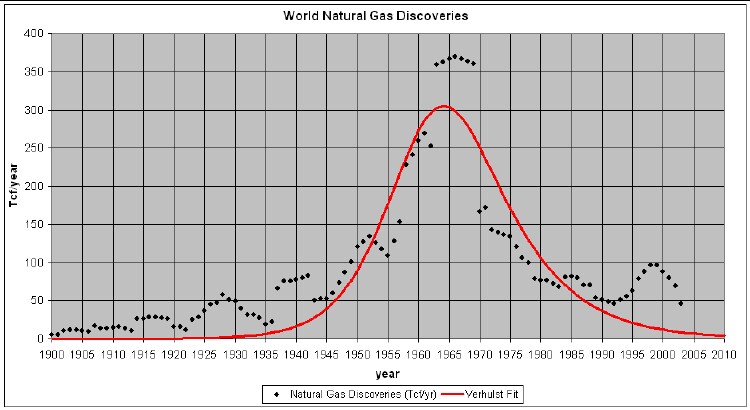
This and the curve below for world natural-gas extraction were fitted together with a common value for amount eventually discovered and extracted (7.8x1015 ft3).
|
|
Comparison of world natural-gas discoveries and extraction.
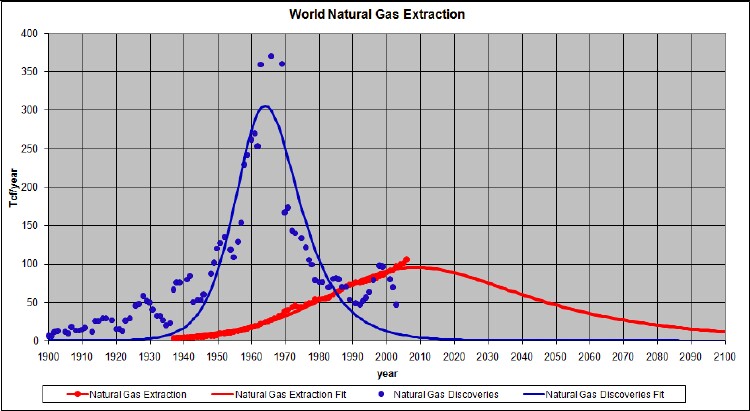
The amount under both curves is about 7.8 x 1015 ft3.
This graph contains information that probably will have the greatest effect on those now living and born in the future. Natural gas cannot be extracted if it has not been discovered! This graph shows very clearly why it is very unlikely that the final amount to be extracted will exceed 8x1015 ft3. So far the amount extracted is about 3x1015 ft3, so we are more than one-third of the way there!
|