
There may be another future peak, which would reduce the years for iron availability.
L. David Roper
http://www.roperld.com/personal/RoperLDavid.htm
2 July, 2016
There has been a large increase in iron-ore extraction since the year 2000, largely due to the increase in China, Brazil, Australia and India. The graph below shows the iron-ore extraction data for the world and double Verhulst function fits to the data in order to extrapolate into the future for two different amounts of eventual extraction.
There may be another future peak, which would reduce the years for iron availability.
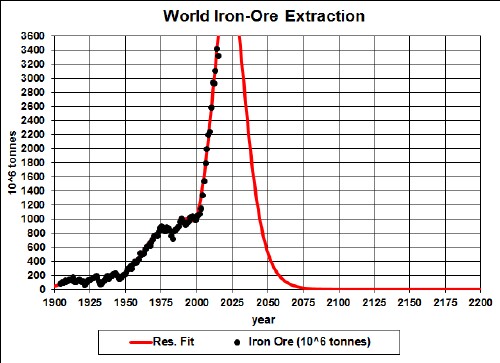
Iron-Ore extraction rate for the world and several Verhulst-functions fit to the data.
The red curve is obtained by restricting the total extraction to the amount already extracted plus the estimated reserve of 170x109 tonnes; the blue curve is obtained by restricting the total extraction to the amount already extracted plus the estimated reserve base of 350x109 tonnes. The green data are for China..
It appears that the recent rapid rise in extraction rate is unsustainable for more that two decades from now.
Taking an average extraction curve of the two fits, the crossover point at year ~2032 when the amount extracted is equal to the amount left to be extracted is shown here:

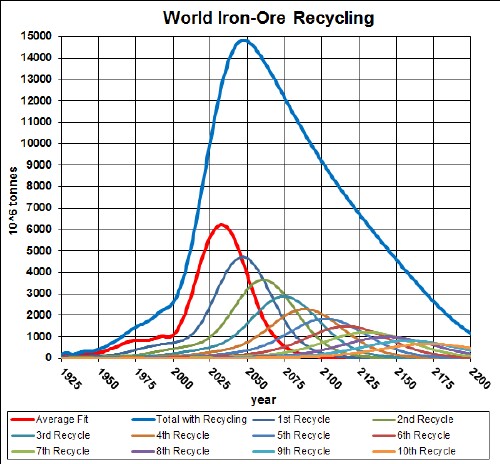
Iron is the most recycled of all minerals. Assume that:
The effective iron-ore available for making items after the first ten recycling cycles is shown in the following graph, along with the effective iron-ore available for each cycle:
The equation for a recycling cycle is
where Ei is the amount available from the previous cycle. Here is an example of the Excel coding:
{=(($J$2+$I$2)/2+(($J$2-$I$2)/2)*TANH((A27-$K$2)/$L$2))*SUM($I$27:I27*(EXP(-1*((A27-$A$27:A27-$N$2)/$O$2)^2/2))/$O$2/SQRT(2*PI()))} (The curly bracket surrounding the term makes it into an array; it must be entered by holding down the SHIFT & CTRL keys while pressing the ENTER key.)
Of course, the recycling could be extended to more cycles, skewing the curve further into the future. However, the peak and fall off after it will not change because further cycles are essentially zero in that time region.
Thus, under the assumptions given above, the effective amount of iron ore available for making items peaks at about 2100 and falls off fairly rapidly after that. Humans will have taken concentrated iron-ore deposits and scattered them across the surface of the earth.
The Excel spreadsheet is set up to make it easy to calculate with different recycling assumptions.
Dividing the iron-ore recycling curve above by the projected world population (asymptote ~1010), one gets:
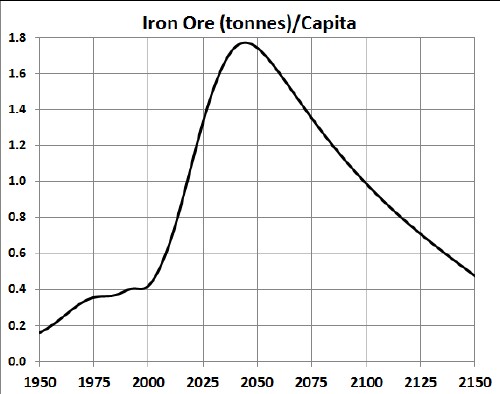
Although the recycling peak is at year ~2070, the per-capita peak is at year ~2050.
I have used this study to study stainless steel.