The fit is using 3 Verhulst functions.
L. David Roper
http://www.roperld.com/personal/roperldavid.htm
5 April, 2016
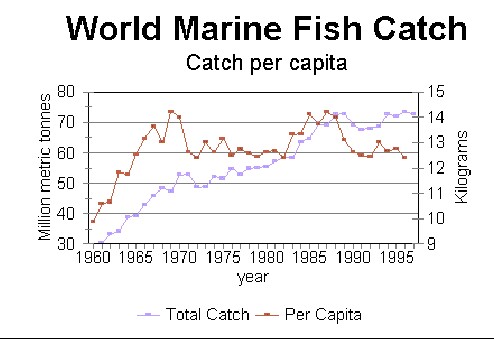
Most of human evolution occurred near sea or ocean shores, so humans evolve nutritionally to prefer seafood. So, it is important to know about the availability of seafood in the future.
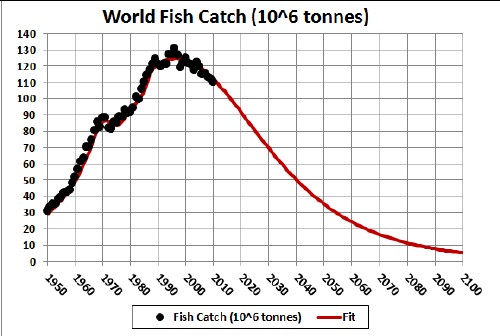
This is an attempt to fit the data for world ocean fish catches in order to project into the future. The data indicate that world ocean fishing has reached a peak. Fish farming is fast increasing to fill the gap.
After the analyses shown below, new data emerged in Nature Communications:
The fit is using 3 Verhulst functions.
If these data are correct, it appears that, if current trends continue, the world fish catch will decimate the fish in the ocean before 2100.
There are at least four ways to fit the fish-catch data above to project into the future:
The four kinds of fits ars:
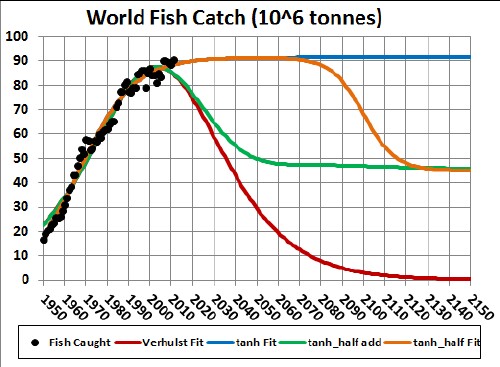
The tanh fit is ![]() , where a = 0, b = 91.4, t0 = 1967 = inflection year and w = 25.3 .
, where a = 0, b = 91.4, t0 = 1967 = inflection year and w = 25.3 .
Some comments about the fits:
The following graph shows the fish-caught per capita for the three future cases considered above:
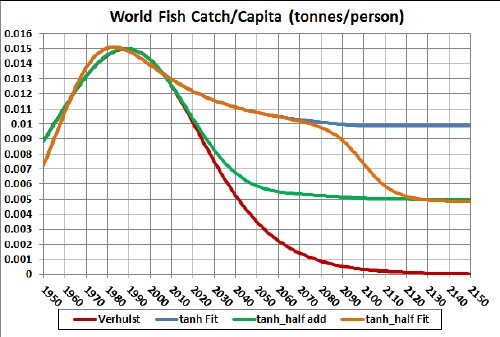
The peak is shortly after 1980 for all three cases.
The following graph shows the global fish catch and the increase in atmospheric carbon dioxide concentration (ppmv):
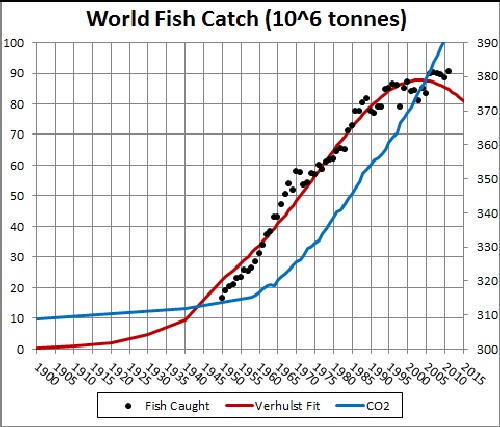
Note that the inflection year for fish catch, 1967, occurs shortly after the CO2 concentration starts climbing rapidly.
When wild-fish catching began to level off at ~1990, fish farming accelerated:
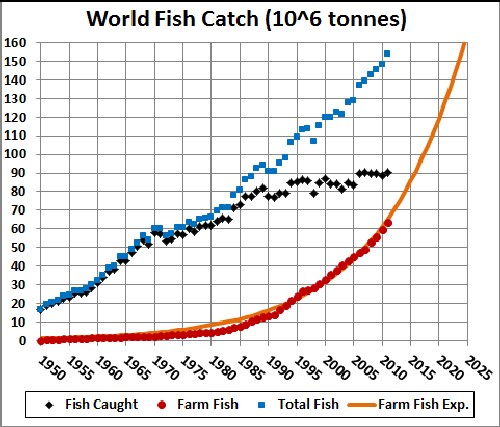
The orange curve is an exponential fit to the fish-farming data between 200 and 2011.
It appears that fish farming will exceed fish catch in ~2016.
There are many environmental problems with fish farming.
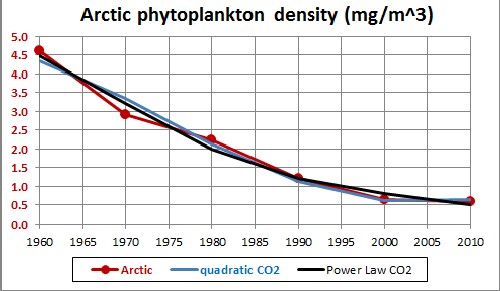
Phytoplankton are responsible for inserting about half of the oxygen into the atmosphere. Krill feed on phytoplankton and krill are eaten by Whales, seals, penguins, squid and fish. So a certain density of phytoplankton in the ocean is necessary to maintain other aquatic life there and for removing carbon dioxide from the atmosphere and convert it into oxygen.
A recent study [Nature 466, 591-596 (29 Jul 2010) Global phytoplankton decline over the past century.] has shown that phytoplankton density has decreased over the last ~50 years. For example the data for the Arctic Ocean and three regions of the Atlantic Ocean are:
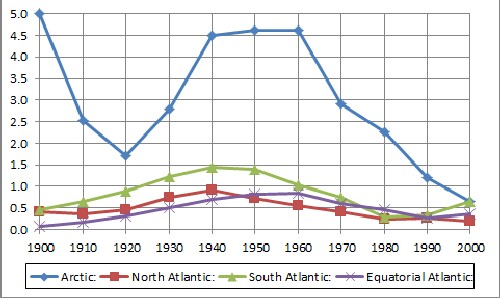
Note how much larger the density in the Arctic Ocean was than in the Atlantic Ocean until the year 2000, which is also the case for comparing the Arctic Ocean to the Pacific Ocean. As in so many other ways, the Arctic is the "canary in the mine" regarding the effects of global warming on phytoplankton density. So, from now on I only consider the phytoplankton density in the Arctic Ocean.
The data stop at year 2000, but it is claimed that phytoplankton density has decreased at ~1% each year since then. The phytoplankton data (fish food) and the assumed ~1% decrease for the Arctic Ocean, along with the fish catch, are:
The tanh inflection point for the fish catch (1967) is about where the phytoplankton decline begins.
The data along with the atmospheric carbon-dioxide concentration (ppmv) are:
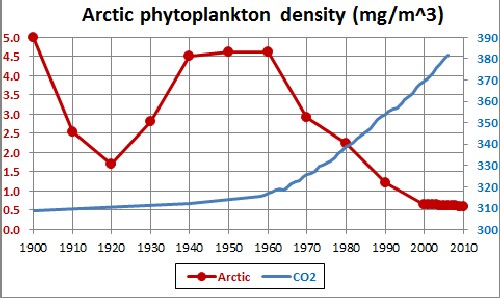
The rapid decline in Arctic phytoplankton density occurs very close to when the CO2 concentration starts climbing rapidly. The earlier decline in Arctic phytoplankton must have some other cause.
The following graph shows a quadratic and a power-law fit of the Arctic phytoplankton decline since 1960 to the CO2 concentration rise:
World ocean fishing has reached a peak, likely due to the rapid decline in phytoplankton in the oceans. This work uses the data to make educated guesses about how much world fishing can be done in the future: either the same as now, some level lower than now or zero. Zero seems the less likely of the three. The per capita
 "Fish farming has dramatically increased in the last 15 years and has more than made up for the loss in production of ocean catch. At first it seems like a solution, and it is in part, but there are limitations. The pollution caused by the large populations of fish and shrimp raised in pens in estuaries is causing significant damage to the local ecosystem, particular in Thailand where there are heavy concentrations of shrimp farms. There is also the issue of food. At present a significant amount of food for raising fish consists of ground fish meal. To the extent that wild fish are caught and deliberately turned into meal to feed farmed fish, the system is counterproductive. It takes roughly 5lb. of fish meal to gain one pound of farmed fish, plus a lot of fuel and expense. At the same time the ocean fish are deprived of their food fish. Better to leave the fish in the ocean to be consumed by their natural predators and catch the larger fish. It is true that some of fish meal is made from byproducts of the fishing industry, but that is near its limit, so additional fish food will have to come from agriculture which is facing its own limitations."
http://www.roperld.com/personal/InterdisciplinaryStudies.htm
L. David Roper, http://www.roperld.com/personal/roperldavid.htm
5 April, 2016