L. David Roper
http://www.roperld.com/personal/roperldavid.htm
16 July, 2017
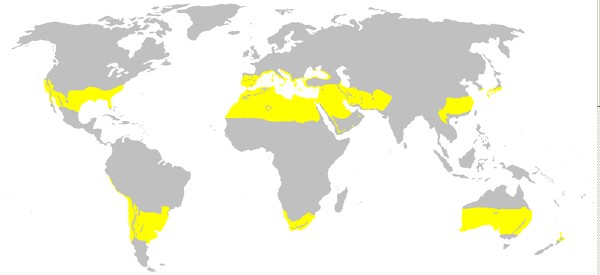
There are several definitions of "subtropical" regions of the Earth:
The following map shows the long-standing subtropical regions:
|
Richmond, Virginia and Virginia Beach, Virginia are subtropical.
I have been wondering if the New River and Roanoke Valleys of Virginia are now subtropical due to global warming, according to the definitions given above. The data are available at http://www.weather.gov/climate/index.php?wfo=rnk . I calculated the average monthly temperatures by averaging the average monthly highs and lows for 2009, the latest year for which all months are available. The results for Blacksburg in the New River Valley and Roanoke in the Roanoke Valley are:
2009 |
Blacksburg |
Roanoke |
Jan-09 |
30.95 |
36 |
Feb-09 |
35.95 |
42.2 |
Mar-09 |
43.3 |
48.3 |
Apr-09 |
52.55 |
57.5 |
May-09 |
61.9 |
65.35 |
Jun-09 |
69.35 |
74.1 |
Jul-09 |
68.4 |
73.3 |
Aug-09 |
71.4 |
76.05 |
Sep-09 |
63.6 |
68.75 |
Oct-09 |
52.25 |
57.25 |
Nov-09 |
45.8 |
51.5 |
Dec-09 |
32.6 |
37.25 |
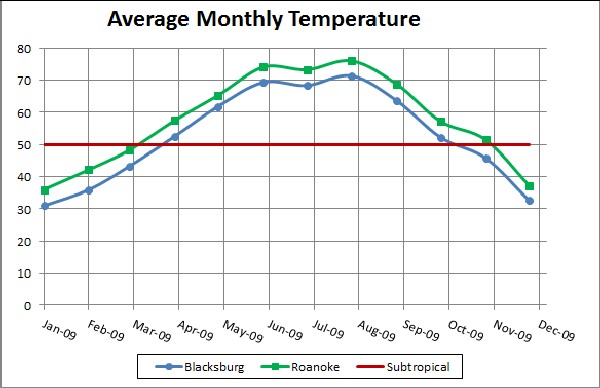
We see that
Thus, Roanoke fits 2 of the 3 different definitions for being subtropical in 2009 and Blacksburg fits 0 of the 3.
The earliest year for which all months are available on the web site is 2005. The results for that year are:
2006 |
Blacksburg |
Roanoke |
Jan-06 |
39.85 |
43.55 |
Feb-06 |
34.7 |
39.55 |
Mar-06 |
43.45 |
48.6 |
Apr-06 |
56.3 |
60.85 |
May-06 |
57.7 |
63.35 |
Jun-06 |
67.1 |
72.2 |
Jul-06 |
72 |
77.55 |
Aug-06 |
72.3 |
78.35 |
Sep-06 |
60.95 |
65.15 |
Oct-06 |
50.9 |
55.4 |
Nov-06 |
45.95 |
50.3 |
Dec-06 |
39.35 |
45.05 |
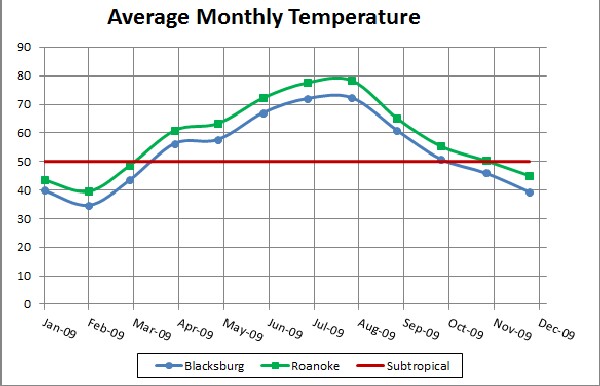
We see that
Thus, Roanoke fits 3 of the 3 different definitions for being subtropical in 2006 and Blacksburg fits 1 of the 3.
The data for Roanoke, Virginia for 2006 and 2009 were intriguing, so I put together all four years for Roanoke available from the Blacksburg weather station, since climate is averaged over many years. The result is:
Roanoke: |
|||||||||||||
| Year |
JAN |
FEB |
MAR |
APR |
MAY |
JUN |
JUL |
AUG |
SEP |
OCT |
NOV |
DEC |
subtropical |
2006 |
43.55 |
39.55 |
48.6 |
60.85 |
63.35 |
72.2 |
77.55 |
78.35 |
65.15 |
55.4 |
50.3 |
45.05 |
50 |
2007 |
41.2 |
34.2 |
53.15 |
55.95 |
67.55 |
74.4 |
75.65 |
82.15 |
71.5 |
63.55 |
48.3 |
43.45 |
50 |
2008 |
37.5 |
41.6 |
49.4 |
57 |
64.2 |
75.9 |
76.05 |
74.15 |
69.65 |
58.15 |
45.95 |
41.8 |
50 |
2009 |
36 |
42.2 |
48.3 |
57.5 |
65.35 |
74.1 |
73.3 |
76.05 |
68.75 |
57.25 |
51.5 |
37.25 |
50 |
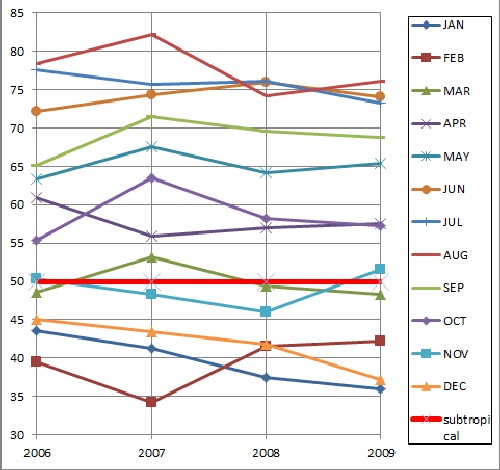
The first subtropical definition is true for three of the four years.
After I had done the work described above, I was informed that data for many more years were available at http://www.sercc.com/cgi-bin/sercc/cliMONtavt.pl?va7285 . These data were already given as monthly average temperatures. The data are shown in the Appendix. The last ten years' data are:
Year |
JAN |
FEB |
MAR |
APR |
MAY |
JUN |
JUL |
AUG |
SEP |
OCT |
NOV |
DEC |
T>50 |
2000 |
35.3 |
43.4 |
51.7 |
54.86 |
67.63 |
73.78 |
73.29 |
72.85 |
65.87 |
59.4 |
44.15 |
30.4 |
8 |
2001 |
36.9 |
42.9 |
43.35 |
59.45 |
64.79 |
73.32 |
74.31 |
76.85 |
66.45 |
56.9 |
53.1 |
43.4 |
8 |
2002 |
42 |
40.9 |
48.16 |
58.77 |
63.95 |
74.48 |
78 |
76.95 |
70.67 |
57.6 |
46.22 |
37.7 |
7 |
2003 |
33.1 |
35.7 |
49.58 |
56.82 |
62.55 |
69.53 |
75.13 |
76.35 |
66.72 |
56.1 |
52.2 |
37.9 |
8 |
2004 |
34.6 |
38.5 |
50.2 |
58.08 |
70.76 |
72.25 |
76.5 |
73.39 |
69.1 |
59.3 |
51.4 |
39.5 |
9 |
2005 |
40.5 |
41.7 |
44.06 |
56.72 |
62.23 |
72.73 |
77.76 |
77.6 |
71.15 |
60.2 |
49.85 |
36.8 |
7 |
2006 |
43.5 |
39.6 |
48.61 |
60.83 |
63.34 |
72.22 |
77.53 |
78.34 |
65.15 |
55.4 |
50.3 |
45.1 |
8 |
2007 |
41.2 |
34.2 |
53.2 |
55.95 |
67.56 |
74.42 |
75.66 |
82.15 |
71.5 |
63.6 |
48.3 |
43.4 |
8 |
2008 |
37.5 |
41.6 |
49.4 |
56.98 |
64.19 |
75.9 |
76.06 |
74.15 |
69.65 |
58.2 |
45.95 |
41.8 |
7 |
2009 |
35.9 |
42.2 |
48.32 |
57.48 |
65.35 |
74.08 |
73.31 |
76.06 |
68.77 |
57.3 |
51.5 |
37.3 |
8 |
Seven of the last ten years had 8 or more months above 50.0 °F.
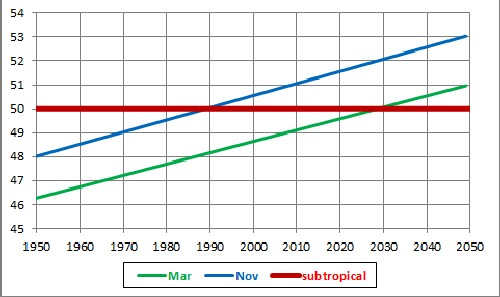
Data for years 1949 to 2009 are:
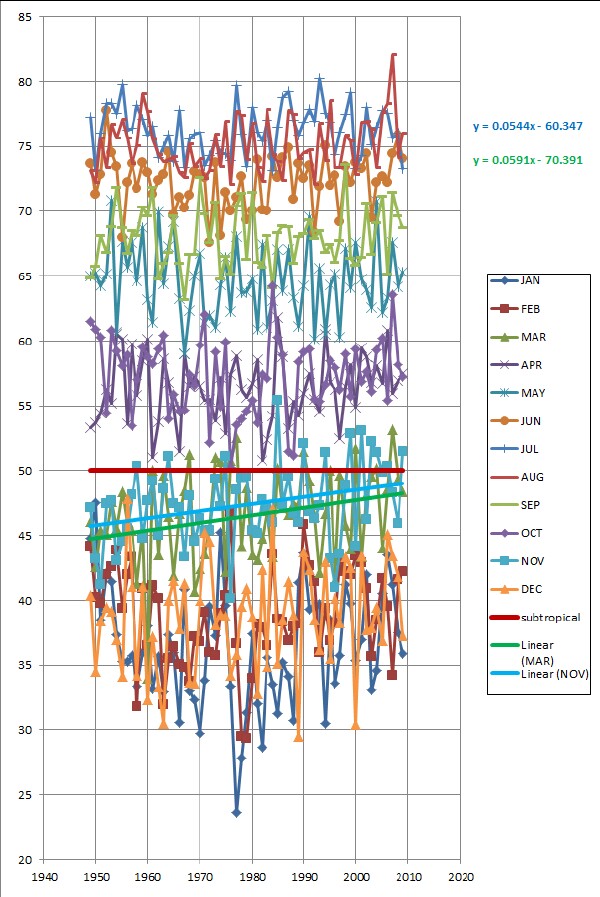
Note the linear trend lines for March and November, the two crucial months, whose equations are given above the legend. November leads March in temperature. Using those equations:
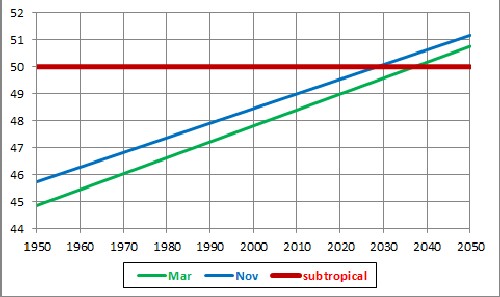
If the linear trend continues, after about 2030 all years in Roanoke, Virginia will be subtropical by the first definition.
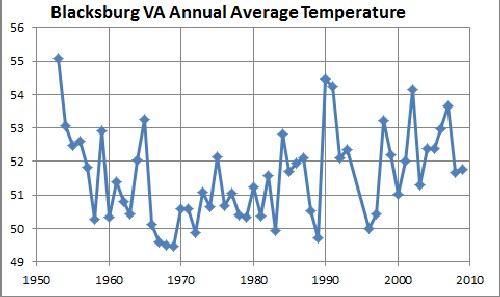
Data are also available from 1953 to 2009, with a few missing years, for Blacksburg, Virginia.
Data for years 1949 to 2009 are:
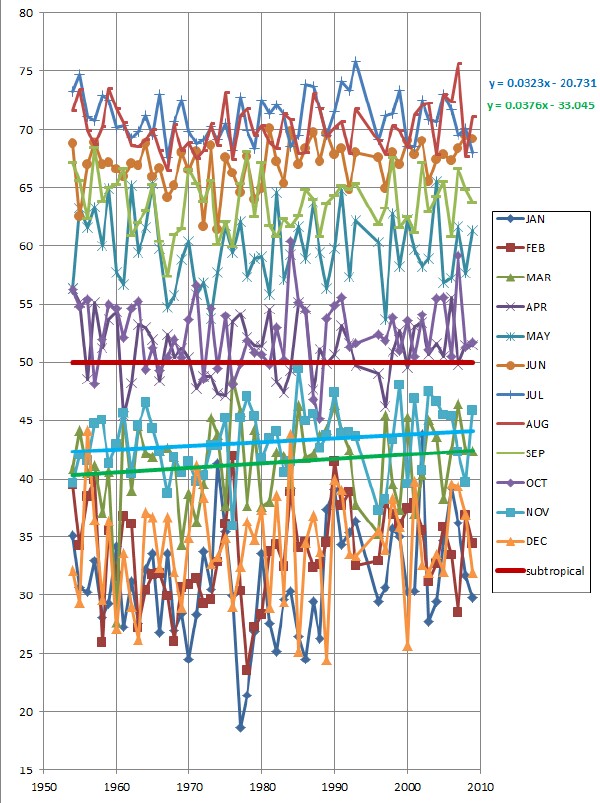
According to this data set there are no subtropical years for Blacksburg from 1949 to 2009. (Apparently my method of averaging the average monthly high and average monthly low is not the correct way to get the average monthly temperature.) Note that the linear trend lines for March and November have a long time to go before crossing the 50.0 °F value; November would have that value at about year 2190.
So, Blacksburg is NOT near to being a subtropical region by the first definition.
Since Richmond, Virginia is listed as a subtropical region, I show here the monthly average temperatures from 1949 to 2009 for Richmond:
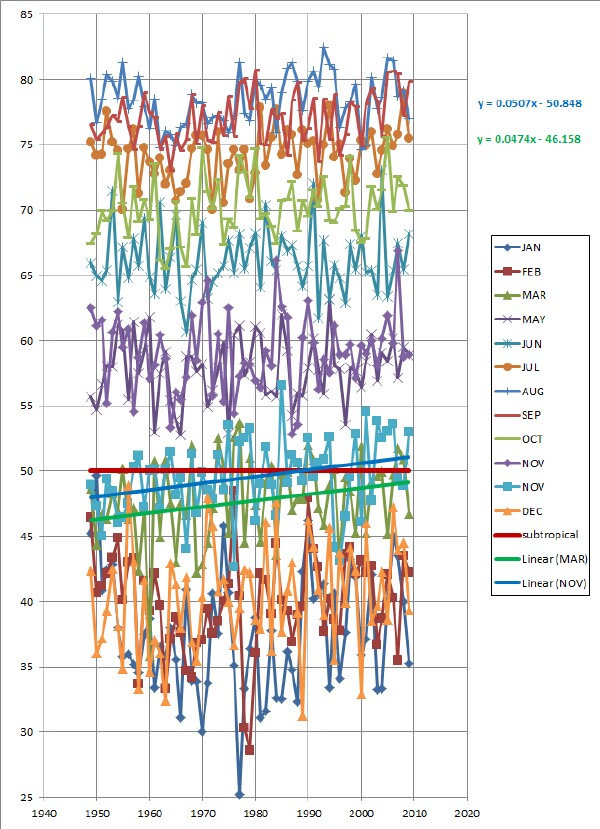
Note that when November is less than 50.0 °F March is often above 50.0 °F, such that 16 of the 20 years from 1990 to 2009 were subtropical by the first definition. The trend line for November crosses the 50.0 °F line at about 1990.
Note the linear trend lines for March and November, the two crucial months, whose equations are given above the legend. November leads March in temperature. Using those equations:
If the linear trend continues, after about 1990 all years in Richmond, Virginia are or will be subtropical by the first definition.
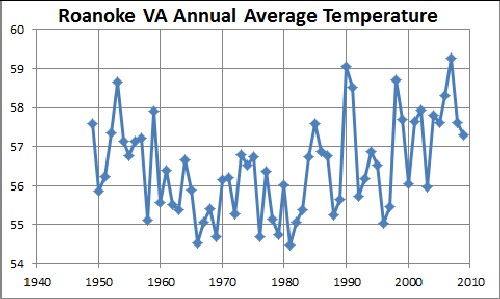
The following graphs show the average annual temperatures for Blacksburg, Roanoke and Richmond VA since about 1950 to 2009:
 |
 |
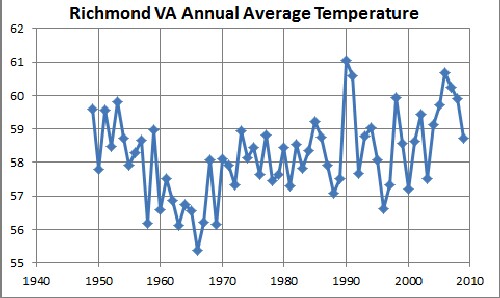 |
Note that all three locations show global dimming due to the huge amount of aerosol pollution burning fossil fuels was putting into the atmosphere before clean-air legislation (1960-1970 UK, 1970 US) reduced the pollution and allowed global warming to take over again.
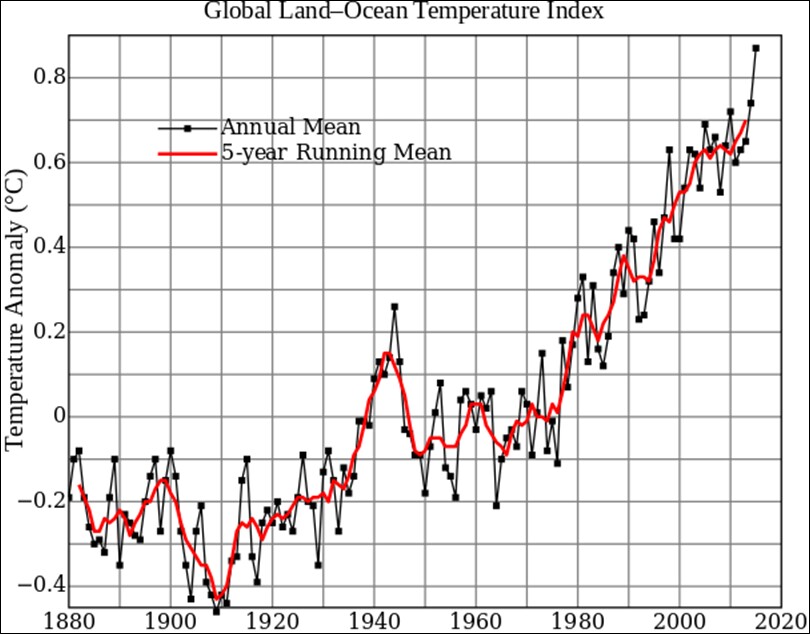
This is similar to what occurs for the global average annual temperatures:
Roanoke, Virginia in the Roanoke Valley is well on the way to being a subtropical region.
Blacksburg, Virginia is NOT on the verge of being a subtropical region.
Richmond, Virginia has been a subtropical region since about 1990.
| YEARS |
JAN |
FEB |
MAR |
APR |
MAY |
JUN |
JUL |
AUG |
SEP |
OCT |
NOV |
DEC |
ANN |
Months >50 |
1949 |
44.8 |
44.1 |
46.1 |
53.29 |
65.02 |
73.65 |
77.26 |
73.16 |
64.85 |
61.5 |
47.13 |
40.4 |
57.6 |
7 |
1950 |
47.5 |
40.3 |
42.58 |
53.65 |
65.23 |
71.35 |
73.16 |
72.26 |
65.77 |
60.9 |
43.22 |
34.5 |
55.87 |
7 |
1951 |
38.4 |
39.8 |
45.4 |
54.45 |
64.23 |
72.83 |
76.03 |
75.66 |
68.12 |
60.3 |
41.18 |
38.4 |
56.23 |
7 |
1952 |
42.1 |
42 |
45.1 |
56.3 |
65.15 |
77.77 |
78.31 |
73.34 |
66.82 |
54.4 |
47.45 |
39.5 |
57.35 |
7 |
1953 |
41.5 |
42.5 |
47.61 |
55.22 |
70.87 |
74.55 |
78.34 |
76.76 |
68.8 |
60.8 |
47.65 |
39.1 |
58.65 |
7 |
1954 |
37.4 |
43.9 |
45.53 |
60.53 |
60.68 |
73.48 |
77.53 |
75.69 |
71.85 |
59.2 |
43.03 |
36.9 |
57.14 |
7 |
1955 |
35.3 |
39.4 |
48.34 |
60.12 |
67.69 |
68 |
79.77 |
77.13 |
68.72 |
58.1 |
44.53 |
34.2 |
56.77 |
7 |
1956 |
35.3 |
42 |
45.92 |
53.58 |
65.69 |
72.23 |
76.24 |
75.68 |
66.77 |
58.9 |
45.58 |
47.8 |
57.14 |
7 |
1957 |
35.7 |
43.4 |
45.4 |
59.75 |
67.61 |
73.7 |
76.44 |
73.66 |
68.53 |
53.5 |
48.12 |
41.1 |
57.23 |
7 |
1958 |
33.4 |
31.8 |
41.29 |
55.82 |
64.61 |
71.78 |
78.15 |
75.02 |
68.13 |
57 |
50.33 |
34.2 |
55.12 |
7 |
1959 |
36 |
40.9 |
45.45 |
58.5 |
68.73 |
73.73 |
77.08 |
79.05 |
70.3 |
59.6 |
44.75 |
41.1 |
57.92 |
7 |
1960 |
38 |
36.5 |
33.97 |
60.13 |
63.16 |
73.02 |
75.87 |
77.69 |
69.62 |
58.7 |
47.7 |
32.3 |
55.56 |
7 |
1961 |
33.2 |
41.1 |
50.05 |
51 |
61.44 |
71.3 |
76.56 |
75.56 |
71.88 |
58.3 |
49.23 |
37.2 |
56.4 |
7 |
1962 |
35.6 |
40.1 |
43.5 |
53.75 |
69.92 |
72.37 |
74.16 |
74.34 |
64.82 |
59.4 |
45 |
33.3 |
55.53 |
7 |
1963 |
32.9 |
32 |
49.66 |
58.6 |
64.42 |
72.85 |
74.94 |
73.85 |
65.98 |
60.5 |
48.57 |
30.5 |
55.39 |
7 |
1964 |
37.3 |
35.5 |
46.47 |
56.83 |
67.31 |
74.62 |
75.85 |
73.95 |
66.82 |
54 |
51.13 |
40 |
56.65 |
7 |
1965 |
36 |
36.4 |
41.89 |
54.9 |
69.19 |
69.72 |
73.84 |
74.19 |
69.65 |
55.9 |
47.47 |
41.5 |
55.89 |
7 |
1966 |
30.6 |
35.1 |
46.66 |
51.45 |
63.26 |
71.08 |
77.82 |
73.02 |
66.02 |
54.6 |
47.17 |
37.8 |
54.53 |
7 |
1967 |
40.8 |
34.8 |
48.45 |
58.98 |
58.97 |
70.23 |
73.39 |
72.58 |
63.22 |
54.7 |
43.33 |
41.3 |
55.06 |
7 |
1968 |
33 |
33.8 |
51.27 |
56.48 |
62.37 |
71.25 |
75.61 |
75.24 |
66.72 |
57.4 |
48.05 |
33.7 |
55.4 |
7 |
1969 |
32.3 |
37.2 |
40.65 |
57.27 |
65.02 |
73.07 |
75.94 |
73.47 |
66.65 |
56.6 |
44.53 |
33.6 |
54.69 |
7 |
1970 |
29.7 |
36.8 |
42.44 |
56.52 |
66.74 |
72.85 |
76.11 |
74.03 |
72.58 |
59.7 |
46.28 |
40 |
56.15 |
7 |
1971 |
33.8 |
39.1 |
43.58 |
55.42 |
61.47 |
72.62 |
73.52 |
72.56 |
69.8 |
62.1 |
45.33 |
45.3 |
56.21 |
7 |
1972 |
39.6 |
36 |
45.58 |
55.5 |
61.98 |
67.63 |
74.29 |
73.16 |
67.58 |
52.1 |
45.4 |
44.5 |
55.28 |
7 |
1973 |
37.2 |
35.7 |
51 |
53.8 |
61.08 |
73.75 |
75.45 |
75.95 |
70.73 |
59.2 |
49.33 |
38.1 |
56.78 |
8 |
1974 |
45.2 |
39 |
50.7 |
57.15 |
64.29 |
68.1 |
74.48 |
73.42 |
64.78 |
55 |
47.25 |
38.9 |
56.52 |
8 |
1975 |
39.6 |
40.4 |
42.19 |
52.87 |
66.45 |
71.5 |
74.47 |
76.98 |
66.53 |
60 |
51.07 |
38.7 |
56.73 |
7 |
1976 |
33.4 |
46.7 |
50.8 |
57.4 |
62.24 |
70.02 |
73.92 |
72.08 |
65.13 |
50.2 |
40.18 |
34.2 |
54.7 |
8 |
1977 |
23.6 |
36.6 |
52.5 |
58.85 |
68.05 |
71.12 |
79.69 |
77.73 |
70.38 |
53.6 |
48.52 |
35.8 |
56.37 |
8 |
1978 |
27.8 |
29.5 |
44.15 |
56.27 |
63.71 |
72.68 |
75.98 |
77.44 |
71.38 |
54 |
49.43 |
39.5 |
55.15 |
7 |
1979 |
31.3 |
29.3 |
48.63 |
55.67 |
63.79 |
69.32 |
73.45 |
73.98 |
66.32 |
54.6 |
49.57 |
40.9 |
54.74 |
7 |
1980 |
37.4 |
34 |
43.52 |
56.7 |
64.77 |
70.02 |
78.05 |
76.79 |
71.47 |
55.4 |
45.38 |
38.7 |
56.02 |
7 |
1981 |
32 |
38.2 |
43.1 |
58.53 |
60.92 |
73.97 |
76.08 |
73.37 |
66.1 |
53.7 |
45.17 |
32.8 |
54.49 |
7 |
1982 |
28.7 |
37.8 |
44.82 |
50.77 |
67.48 |
70.12 |
75.45 |
72.32 |
65.73 |
57.4 |
47.78 |
42.3 |
55.06 |
7 |
1983 |
35.6 |
36.5 |
46.95 |
52.37 |
61.02 |
70.05 |
77.02 |
77.9 |
68.1 |
57.1 |
47.07 |
34.9 |
55.38 |
7 |
1984 |
33.5 |
43.6 |
43.34 |
54.22 |
63.1 |
74.2 |
73.18 |
74.37 |
64.08 |
64.3 |
46 |
47.1 |
56.75 |
7 |
1985 |
31.2 |
38.6 |
50.2 |
61.82 |
67.05 |
72.63 |
76.47 |
73.81 |
68.35 |
60.3 |
55.42 |
35.1 |
57.58 |
9 |
1986 |
35.2 |
38.3 |
47.13 |
58.77 |
63.85 |
74.13 |
78.81 |
72.39 |
68.92 |
58.9 |
47.37 |
38.5 |
56.86 |
7 |
1987 |
34.2 |
36.9 |
46.6 |
53.23 |
67.1 |
74.93 |
79.24 |
77.79 |
68.85 |
51.5 |
49.57 |
41.4 |
56.77 |
7 |
1988 |
30.7 |
37.9 |
47.48 |
55.33 |
63.34 |
70.93 |
77.05 |
77.45 |
65.97 |
51.2 |
46.68 |
38.9 |
55.24 |
7 |
1989 |
41.3 |
38.2 |
47.35 |
54.25 |
61.15 |
73.68 |
75.89 |
74.05 |
68.05 |
58.4 |
46.02 |
29.5 |
55.66 |
7 |
1990 |
43.6 |
45.9 |
51.5 |
56 |
64.23 |
72.55 |
76.84 |
74.55 |
68.32 |
59.2 |
52.1 |
43.7 |
59.04 |
9 |
1991 |
39.3 |
42.7 |
49.18 |
57.5 |
69.6 |
73.52 |
77.85 |
74.77 |
69.32 |
59.4 |
46.8 |
42.3 |
58.52 |
7 |
1992 |
39.6 |
41.5 |
46.48 |
55.48 |
60.16 |
68.37 |
76.94 |
72.06 |
67.92 |
55.5 |
46.32 |
38.5 |
55.73 |
7 |
1993 |
39.7 |
35.9 |
42.11 |
54.5 |
65.6 |
71.92 |
80.24 |
76.82 |
68.53 |
55.3 |
47.28 |
36.2 |
56.18 |
7 |
1994 |
30.5 |
39.4 |
46.69 |
60.92 |
60.53 |
75.05 |
77.53 |
73.92 |
66.85 |
56.6 |
51.4 |
42.9 |
56.86 |
8 |
1995 |
38.5 |
36.9 |
50.1 |
56.78 |
64.32 |
71.98 |
76.9 |
78.52 |
67.42 |
58.5 |
43.17 |
35.5 |
56.54 |
8 |
1996 |
33.6 |
38.2 |
41.61 |
56.3 |
65.16 |
72.75 |
74.4 |
73.37 |
66.08 |
57.9 |
40.97 |
40.1 |
55.04 |
7 |
1997 |
35.8 |
43 |
49.66 |
52.47 |
60.27 |
69.18 |
76.1 |
73.37 |
67.73 |
56.2 |
43.6 |
38.3 |
55.47 |
7 |
1998 |
41.2 |
42.2 |
45.76 |
56.5 |
67.11 |
73.47 |
77.45 |
75.87 |
73.57 |
59 |
48.92 |
43.4 |
58.7 |
7 |
1999 |
39.8 |
42 |
43.94 |
58.13 |
64.08 |
72.25 |
79.15 |
75.44 |
66.4 |
55.7 |
52.88 |
42.5 |
57.69 |
7 |
2000 |
35.3 |
43.4 |
51.7 |
54.86 |
67.63 |
73.78 |
73.29 |
72.85 |
65.87 |
59.4 |
44.15 |
30.4 |
56.06 |
8 |
2001 |
36.9 |
42.9 |
43.35 |
59.45 |
64.79 |
73.32 |
74.31 |
76.85 |
66.45 |
56.9 |
53.1 |
43.4 |
57.65 |
8 |
2002 |
42 |
40.9 |
48.16 |
58.77 |
63.95 |
74.48 |
78 |
76.95 |
70.67 |
57.6 |
46.22 |
37.7 |
57.94 |
7 |
2003 |
33.1 |
35.7 |
49.58 |
56.82 |
62.55 |
69.53 |
75.13 |
76.35 |
66.72 |
56.1 |
52.2 |
37.9 |
55.97 |
8 |
2004 |
34.6 |
38.5 |
50.2 |
58.08 |
70.76 |
72.25 |
76.5 |
73.39 |
69.1 |
59.3 |
51.4 |
39.5 |
57.79 |
9 |
2005 |
40.5 |
41.7 |
44.06 |
56.72 |
62.23 |
72.73 |
77.76 |
77.6 |
71.15 |
60.2 |
49.85 |
36.8 |
57.61 |
7 |
2006 |
43.5 |
39.6 |
48.61 |
60.83 |
63.34 |
72.22 |
77.53 |
78.34 |
65.15 |
55.4 |
50.3 |
45.1 |
58.32 |
8 |
2007 |
41.2 |
34.2 |
53.2 |
55.95 |
67.56 |
74.42 |
75.66 |
82.15 |
71.5 |
63.6 |
48.3 |
43.4 |
59.26 |
8 |
2008 |
37.5 |
41.6 |
49.4 |
56.98 |
64.19 |
75.9 |
76.06 |
74.15 |
69.65 |
58.2 |
45.95 |
41.8 |
57.61 |
7 |
2009 |
35.9 |
42.2 |
48.32 |
57.48 |
65.35 |
74.08 |
73.31 |
76.06 |
68.77 |
57.3 |
51.5 |
37.3 |
57.29 |
8 |
https://en.wikipedia.org/wiki/List_of_locations_with_a_subtropical_climate