 .
.L. David Roper
http://www.roperld.com/personal/roperldavid.htm
5 April, 2016
It is important to be able to predict sunspot numbers in future years because the signal an increase of slight energy output of the Sun. They correlate with solar flares, which can disrupt electromagnetic signals used in communications and control systems.
http://en.wikipedia.org/wiki/Sunspots:
"The number of sunspots correlates with the intensity of solar radiation over the period since 1979, when satellite measurements of absolute radiative flux became available. Since sunspots are darker than the surrounding photosphere it might be expected that more sunspots would lead to less solar radiation and a decreased solar constant. However, the surrounding margins of sunspots are brighter than the average, and so are hotter; overall, more sunspots increase the sun's solar constant or brightness. The variation caused by the sunspot cycle to solar output is relatively small, on the order of 0.1% of the solar constant (a peak-to-trough range of 1.3 W m−2 compared to 1366 W m−2 for the average solar constant). Sunspots were rarely observed during the Maunder Minimum in the second part of the 17th century (approximately from 1645 to 1715). This coincides with the middle (and coldest) part of a period of cooling known as the Little Ice Age."
In this study I create a parametrization of sunspot numbers that agrees reasonably well with data used in the fit (years 1700 to 2009) and earlier data. Then I use the parametrization to predict future sunspot numbers out to year 2050.
Hathaway, Wilson and Reichmann (HWR) created a parametrization for each cycle of sunspots for years 1755 to 1992. The equation for each cycle is
.
A table is given of the parameters a, t0 (cycle starting time in months) and b for each cycle (c=0.71=asymmetry parameter). I used those parameters' values to create the following graph compared to the average yearly sunspot data.
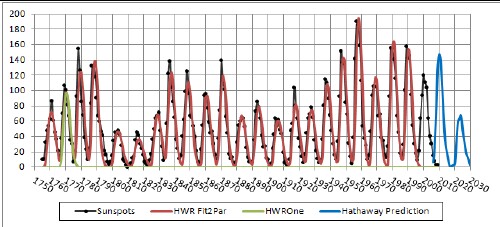
The green curve at 1765 shows one of the cycle curves. The blue curve is the Hathaway prediction for the next two cycles .
I used the equation given above and a rough parametrization by HWR of the three parameters (a, t0, b) to create a parametrization of them to be able to "predict" previous sunspot data and predict future sunspot data. The parametrizations are
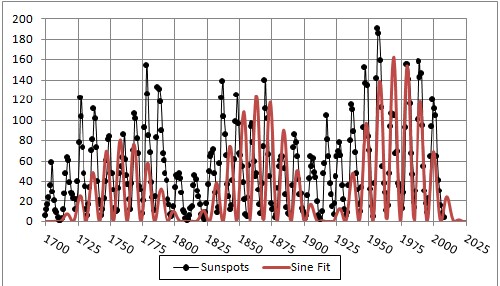
The following graph shows the fit of the parametrization to the average-yearly data between 1700 and 2009 and the prediction for earlier and later years.
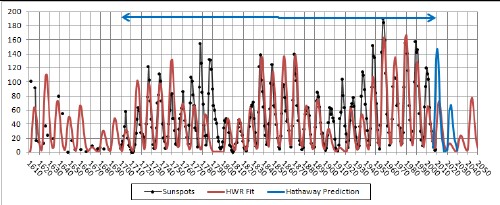
The fit-data range is shown at the top. The blue curve is the Hathaway prediction for the next two cycles .
Although the fit is not so good for large sunspot numbers, especially around 1780, it is pretty good for regions of low sunspot numbers. The fit used data only after the year 1700; however, it agrees reasonably well for the Maunder Minimum (1645-1830). The minimum 1800-1830 is called the Dalton Minimum.
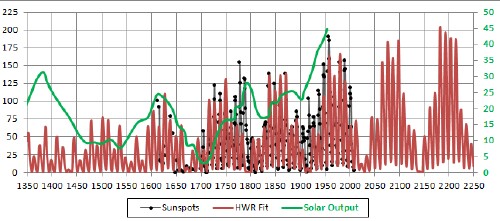
There is an earlier minimum in solar activity called the Spörer Minimum (1460-1550). The following graph shows a solar activity curve (in arbitrary units) and the sunspots prediction back to include the Spörer Minimum and forward to year 2250.
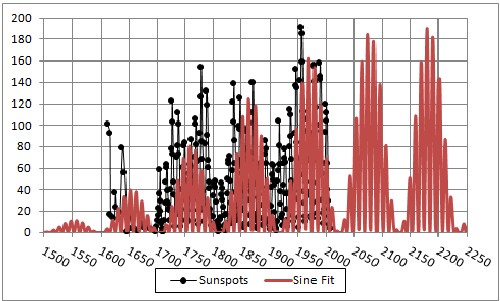
Another approach for roughly predicting future sunspot numbers is to fit a product of sine-squared functions to the data. Here is one such fit with three sine-squared functions of wave lengths 21.1 years, 213 years and 2870 years:
 |
 |
The parametrization used here predicts that the next few decades will have low sunspot numbers. It may mask some of the warming due to anthropogenic global warming. But, by 2075 solar activity will increas slightly to aid global warming.
Apparently, solar activity related to sunspots numbers does not have a very large effect on Earth average temperature.