Uranium extraction rate for the World and Verhulst function fits to the data.
L. David Roper
http://www.roperld.com/personal/roperldavid.htm
29 November, 2023
Nuclear Power Decline
Peak Uranium
Some propose that more nuclear power plants be built for generating electric power. This has been done on a large scale in France (about 75% of electric power in 2005), although the United States obtains more power from uranium than does France.
The electric power generated could be used to charge energy storage devices in vehicles for transportation.
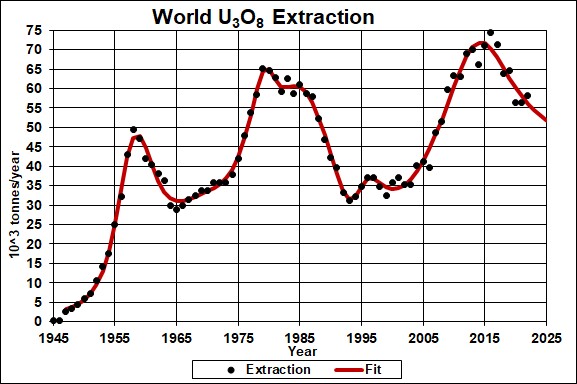
The graph below shows the uranium extraction data for the World and a 6-Verhulst function fit to the extraction data in order to extrapolate into the future. The fit to U3O8 extraction data is done using the estimated uranium resources (7,167x103 tonnes)'.
Uranium extraction rate for the World and Verhulst function fits to the data.
where  and
and 
Note that the two big pushes (1955-1965 in the United States and Western Europe and 1975-1990 in Eastern Europe and the United States and Western Europe) to extract uranium during the Cold War, most of which went into building huge amounts of nuclear weapons by the United States and the Soviet Union. There is a program of the United States and Russia, called the “Megatons to Megawatts Program”, for converting high-enriched uranium used in weapons into low-enriched uranium to be used for electric power.
The graph below shows the extrapolation of the fit to year 2100.
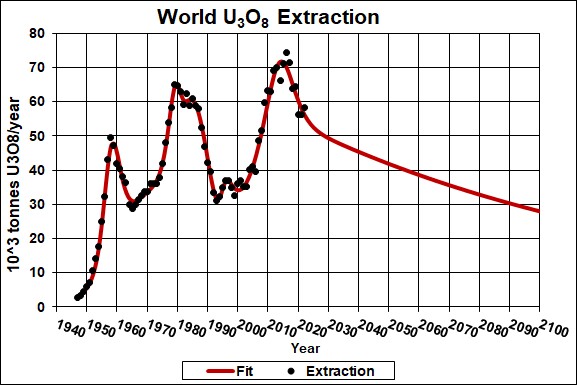
I expect that there will be a large peak in uranium extraction in the next few decades as crude oil and natural gas extraction decline, followed by a possible sharp dip after a major nuclear-reactor accident or terrorism involving a nuclear reactor, and then a rise again to then follow the declining curve of uranium depletion.
The four major extractors of uranium are Canada, Australia, Commonwealth of Independent States (11 states of the former Soviet Union) and the United States
A useful number: 238*3/(16*8+238*3) = 0.848 = fraction of U in U3O8.
It is interesting to compare the analysis above for world uranium extraction to the world demand for uranium. The demand data do not include the use of uranium for weapons in World War II and the Cold War. When a Verhulst function is fitted to the demand with the total available equal to the total amount available result given above, 8,800x103, the following graph is obtained:
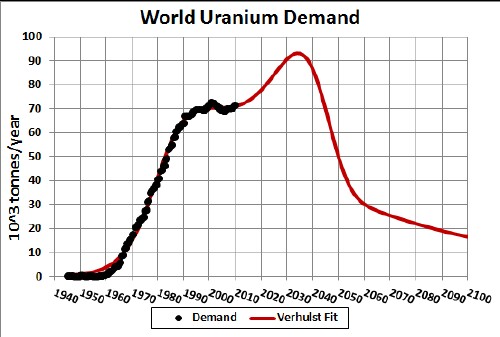
Note that the curve is asymmetrically skewed toward the falling (high-time) side. There may be multiple peaks in the future; if that is the case, the drop in demand will be even faster after the peaks. There are many factors that cause the impending drop in world uranium demand, one of which is the fact that uranium was taken from weapons to be used for nuclear power instead of mined; now that mined uranium is needed for nuclear power it cannot be extracted fast enough to meet the demand.
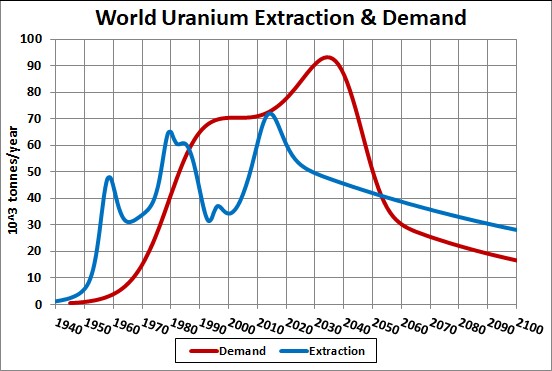
The following graph show the extraction fit and the demand fit together:
The areas under the two curves, the total amount eventually extracted and used (7,927x103 tonnes), are the same. The uranium mined for weapons in the first two peaks was later removed from weapons and used for nuclear power. The fact that the two curves enclose the same area can be seen by plotting the total amounts extracted and used versus time on the same graph:
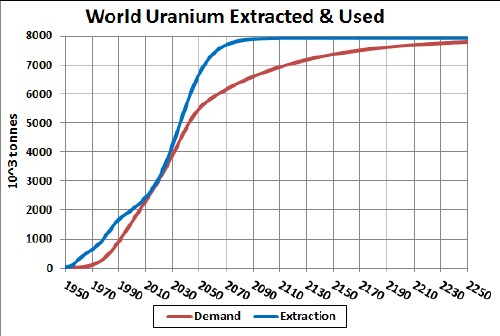
Both curves approach the same asymptote of 7,927x103 tonnes. Note the near bottle neck from ~2010 to ~2030 when the uranium extraction barely meets the demand.
Note that, no matter how fast the remaining uranium is mined, uranium consumption is peaking because of the past use of weapons uranium in power reactors, which kept the price of mined uranium too low for mining to occur. So, now, uranium mining cannot ramp up fast enough to meet the demand.
The price ($/lb) for U3O8 versus year had a severe downturn in 2011:
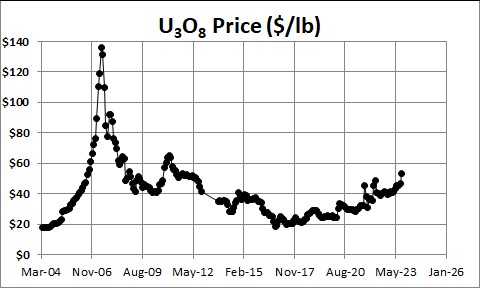
The downturn is due to the Fukushima nuclear disaster in March 2011 and the subsequent decisions by Germany and Japan to diminish their dependence on nuclear energy in the future.
The environmental situation for use of uranium as an energy source is very problematical:
Benford relates the history and details of attempts to design warning systems for humans up to 10,000 years from now regarding underground storage sites for radioactive nuclear wastes. It is interesting that this time period is about the time to the first minimum of the next Major Ice Age. Perhaps humans will dig up the radioactive wastes to try to use them to keep warm or for religious rites. Read about how an event similar to the latter happened in Brazil: http://roperld.com/GRI.htm .
For more positive views of nuclear power see http://en.wikipedia.org/wiki/Nuclear_power and World Nuclear Association.
For negative views of nuclear power including a net energy analysis, see Nuclear Power: The Energy Balance, Uranium Resources and Nuclear Energy, Nuclear Power is Not the Answer by Helen Caldicott.
An interesting question to ask is how much primary energy is supplied by "burning" uranium in nuclear reactors? The best analysis of energy produced by nuclear reactors I have found gives the following constants needed to do this calculation:
The amount of nuclear thermal energy produced by reactors as a function of time, assuming a very optimistic amount of nuclear resources, is shown in the following graph:
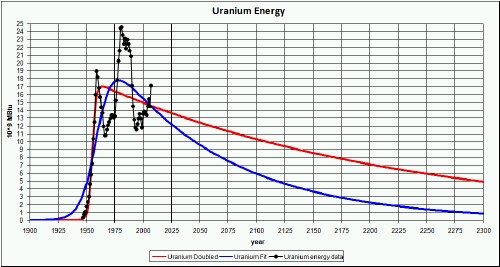
The red curve is a fit where the amount to eventually be extracted is double the amount of the blue curve, an extremely optimistic case.
It was assumed that all uranium mined is eventually used to extract energy. Of course, much of it was used and will be used to make nuclear weapons; however, some weapons were dismantled and their uranium used to extract energy. So this calculation is extremely optimistic for useful electrical energy that can be gotten from uranium.
The graph below compares the world energy consumption to the total energy supplied by the fossil fuels and uranium:
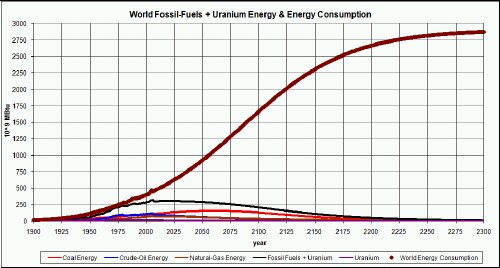
Doubling the total uranium finally extracted has very little effect. The conclusion is that uranium will never supply very much energy for humans to use.
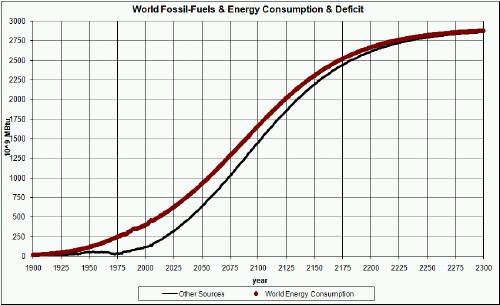
The amount of energy that must be supplied by sources other than fossil fuels and uranium are shown in the graph below:
Some claim that using breeder reactors instead of normal nuclear reactors will help solve the problem of fossil-fuels depletion. The claim is that breeder reactors will allow almost all of the uranium to yield energy instead of only about 1% as is the case for normal nuclear reactors. If that were true the uranium energy curve would be multiplied by about 100 in the graphs above.
Since breeder reactors are much more complicated than normal nuclear reactors and very little energy will be produced by normal nuclear reactors, the eventual amount of increase in nuclear energy for breeder reactors is probably far less that 100 times what will be produced by normal nuclear reactors. So, I would guess that the amount will be about 10 times what will be produced by normal nuclear reactors. That is, instead of nuclear energy from uranium fuel peaking at about 18x109 MBTU/year it would probably peak at about 180x109 MBTU/year, if indeed breeder reactors ever work out on a large scale. This is about the size of each of the fossil-fuels energy contribution and peaking at about the same time as or somewhat later than fossil fuels peak. That is, uranium fuel is not the salvation from fossil-fuels peaking.
Some claim that thorium will greatly increase the amount of nuclear energy available for human use, since thorium is three to five times more abundant in the Earth crust than is uranium. Bombarding thorium with slow neutrons converts it into uranium 233, which is fissionable similar to uranium 235.
Thorium nuclear reactors are more complicated than are uranium reactors. So, I would guess that the amount of energy available for use by humans from thorium fuel will never be as large as that available from uranium fuel.
I have done a depletion analysis of thorium.
Hopefully, the remaining uranium will be used to provide the energy needed to prepare the infrastructure for the solar future.
It is possible that the decline in extraction of fossil fuels will cause a population collapse. This would surely cause the world energy consumption to also fall to some new asymptote. In that case the amount of energy that must be supplied by other than fossil fuels and uranium would be less than shown above.
Coles Hill Uranium Mine Depletion Study
Nuclear Power Decline
L. David Roper interdisciplinary studies
L. David Roper, http://www.roperld.com/personal/roperldavid.htm
29 November, 2023