L. David Roper
http://www.roperld.com/personal/roperldavid.htm
6 April, 2016
Solar-photovoltaic-energy installations have been growing at a fast pace. This is an attempt to project world solar-photovoltaic-energy installations into the future.
Two good sources of information about world solar-photovoltaic energy are:
I use the data from those sources in this calculation.
The fits given here involve fitting the hyperbolic-tangent function,
![]() ,
,
by varying its three parameters to the estimated solar-photovoltaic-energy consumed in Terrawatt-hours each year.
Solar-photovoltaic-energy is in such an early stage of exponential growth that fitting the yearly data does not determined the eventual amount to be produced.
From Ref. 2 above:
"Apart from their own efficiency figures, PV systems work within the limited power density of their location's insolation. Average daily insolation (output of a flat plate collector at latitude tilt) in the contiguous US is 3-7 kilowatt·h/m² and on average lower in Europe." So, I will use 5 GWh/ km2.
"The current market leader in solar panel efficiency (measured by energy conversion ratio) is SunPower, a San Jose based company. Sunpower's cells have a conversion ratio of 23.4%, well above the market average of 12-18%. However, advances past this efficiency mark are being pursued in academia and R&D labs with efficiencies of 42% achieved at the University of Delaware in conjunction with DuPont by means of concentration of light. The highest efficiency achieved without concentration is by Sharp Corporation at 35.8% using a proprietary triple-junction manufacturing technology in 2009." So, I will use 20% efficiency.
"Physicists have claimed that recent technological developments bring the cost of solar energy more in parity with that of fossil fuels. In 2007, David Faiman, the director of the Ben-Gurion National Solar Energy Center of Israel, announced that the Center had entered into a project with Zenith Solar to create a home solar energy system that uses a 10 square meter reflector dish. In testing, the concentrated solar technology proved to be up to five times more cost effective than standard flat photovoltaic silicon panels, which would make it almost the same cost as oil and natural gas. A prototype ready for commercialization achieved a concentration of solar energy that was more than 1,000 times greater than standard flat panels." I will be conservative and assume that the average multiplication over time will be 100.
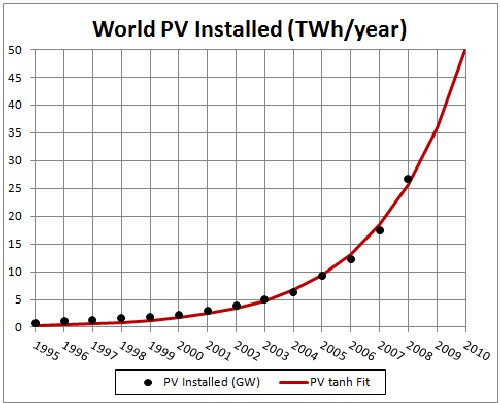
This shows the fit to the solar-photovoltaic-energy data for an asymptotic value of 110,000 Terrawatt-hours per year. |
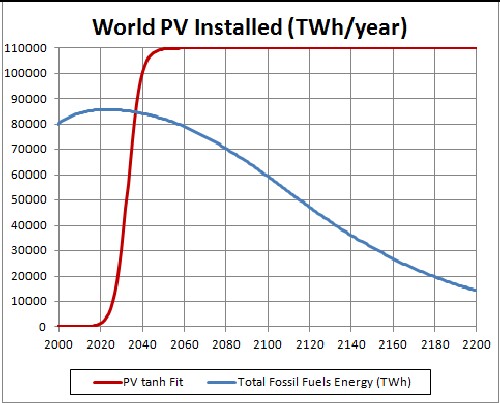
This shows the projection of the fit into the future and compares the projection to the energy available from fossil fuels. The crossover year is about 2035. |
Earth land area: 1.49x10⁸ km2 (29%). Surface area: 5.10x10⁸ km2. (1 km2=247.1 acres=100 hectares). Arable land: 13.31% of surface (6.8x10⁷ km2); 4.71% (2.4x10⁷ km2) supports permanent crops. 40% is used for cropland and pasture (1.3x10⁷ km2 cropland, 3.4x10⁷ pastureland). Mean height of land above sea level is 840 m.
The aymptote of 1.1x10⁵ TWh/year of the fit to the solar-photovoltaic energy could be generated by using about ~0.7% of the land area of the Earth: 1.1x10¹⁷Wh/5x103(Wh/m2)/106(m2/km2)/100/0.2 = 1.1x10⁶ km2, which is 0.74% of the Earth land area.