L. David Roper
http://www.roperld.com/personal/roperldavid.htm
5 April, 2016
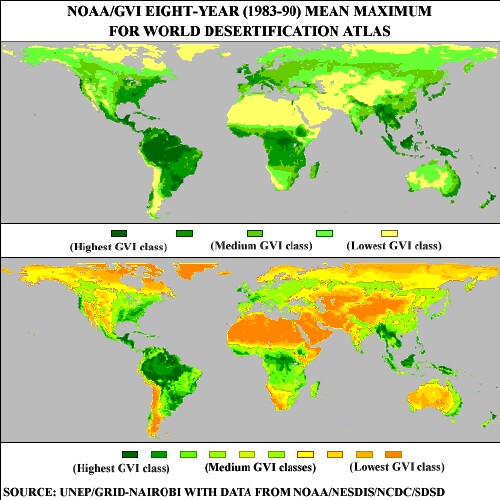
In my quest to analyze data of global systems that are affected by or affect global warming, I have been looking for data about the global desertification to analyze. See http://www.eoearth.org/article/Desertification .
About one-third of the land area of the Earth is classified as arid or semi-arid desert.
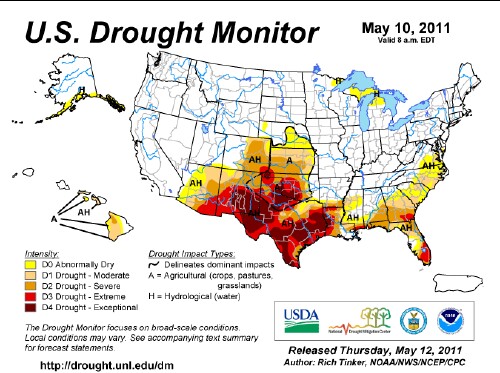
The categories of droughts for the U.S. Drought Monitor are:
D0 |
D1 |
D2 |
D3 |
D4 |
Abnormally Dry |
Moderate Drought |
Severe Drought |
Extreme Drought |
Exceptional Drought |
The data are weekly averages in %.
Here is the map of the contiguous U.S. Drought Monitor for 10 May 2011:
|
|
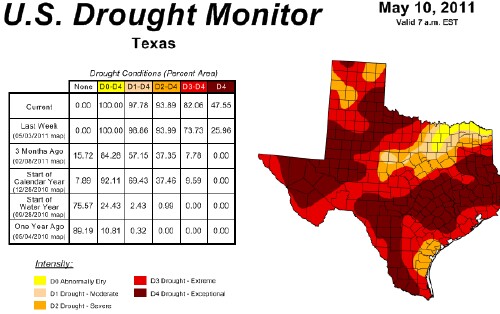
Obviously the state of Texas is a special case, as it appears to have been receiving the brunt of the droughts in the U.S. since January 2000. Here are the weekly averages for the U.S. and Texas from January 2000 through 10 May 2011:
Date |
None |
D0-D4 |
D1-D4 |
D2-D4 |
D3-D4 |
D4 |
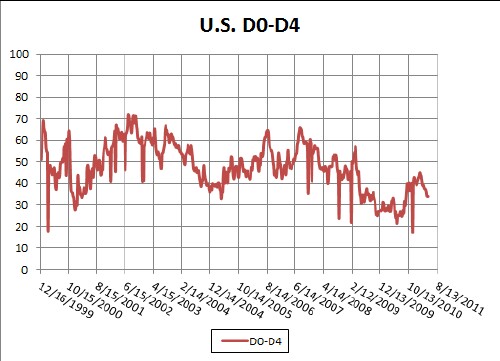
U.S. Average: |
52.59% |
47.41% |
29.16% |
16.33% |
6.47% |
0.94% |
Texas Average: |
49.44% |
50.56% |
33.39% |
19.04% |
7.46% |
1.65% |
Texas does not appear much different from the entire U.S. for the weekly averages. However, Texas has experience wild oscillations between droughts and rainfall, as shown in the graphs below:
 |
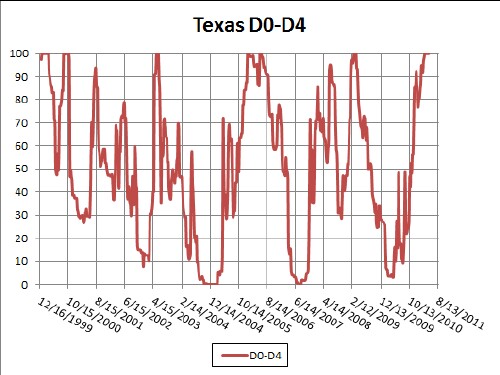 |
Fitting a sine function to the Texas D0-D4 data yields:
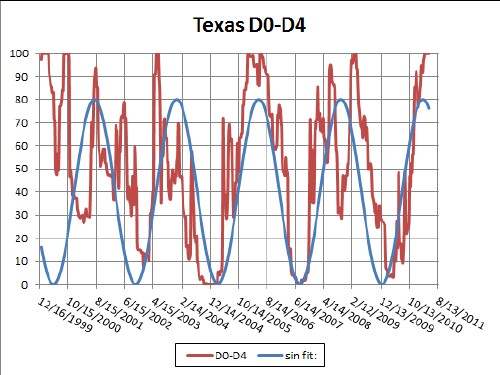
The wavelength is 878.1 days/28.85 months/2.404 years. The sine amplitude is 40.09%; so, the total amplitude from minimum to maximum is 80.18%
L. David Roper interdisciplinary studies
L. David Roper, http://www.roperld.com/personal/roperldavid.htm