L. David Roper
http://www.roperld.com/personal/roperldavid.htm
5 April, 2016
I was born in 1935 and reared in northwest Oklahoma, a part of the dust bowl (1930-1940) and of Tornado Alley, where I experienced two severe tornadoes, including the powerful Woodward OK tornado of 9 April 1947, and saw several others from a distance. So, I have long had a strong interest in tornadoes.
I was able to find copious data for tornadoes in the United States, so I decided to use those data as a measure of extreme weather. Of course, tornadoes are probably not a good proxy for floods and droughts, for example.
There is a standard scale for tornado power, the Fujita Scale:
Fujita Scale |
Circular speed (mph) [average] |
Damage |
F0 |
40-72 [56] |
Light |
F1 |
73-112 [92.5] |
Moderate |
F2 |
113-157 [135] |
Considerable |
F3 |
158-206 [182] |
Severe |
F4 |
207-260 [233.5] |
Devastating |
F5 |
261-318 [289.5] |
Incredible |
Copious tornado data from year 1950 are available. I use those data here to try to find out if tornado energy has increase over time due to global warming.
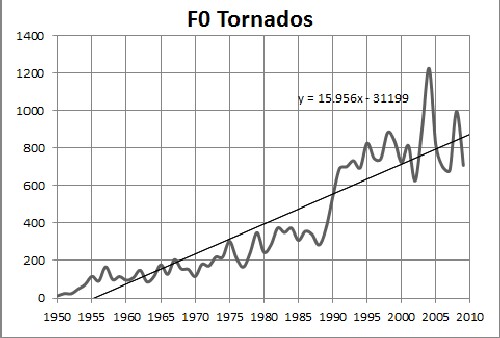
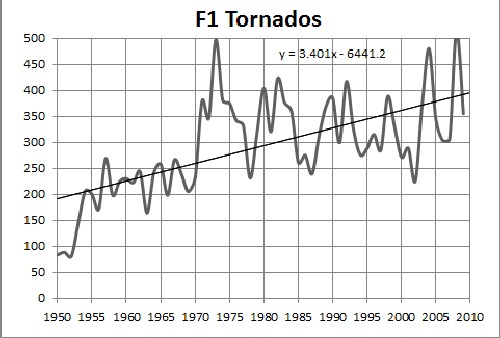
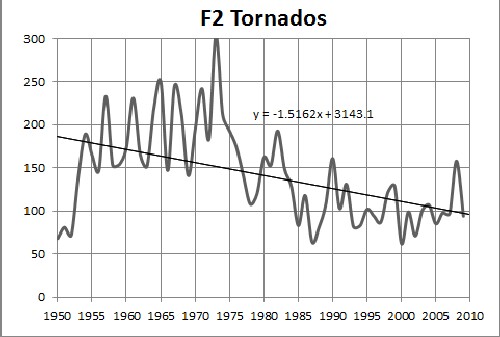
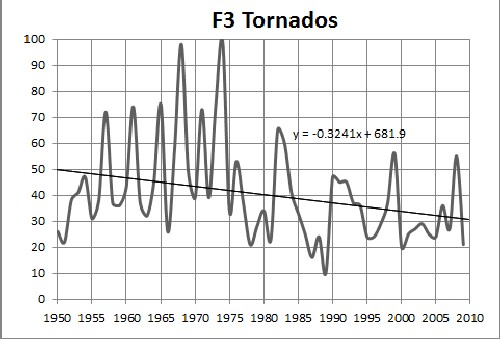
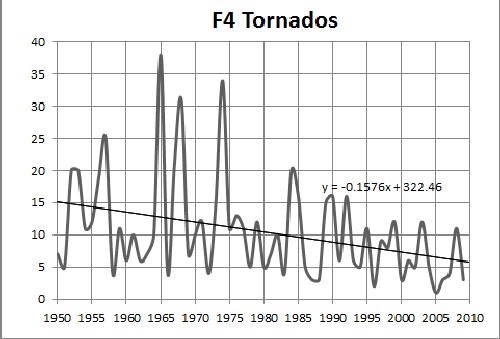
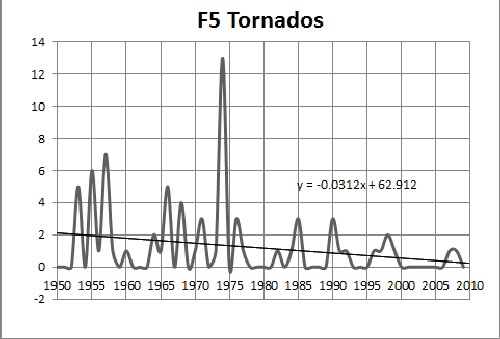
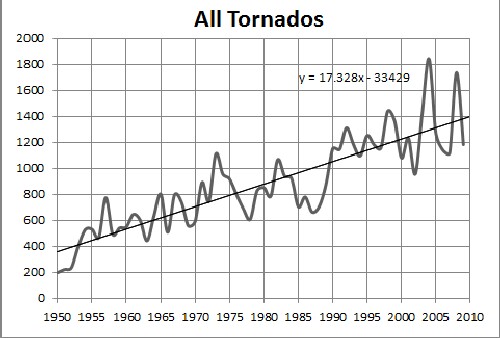
Here are plots of tornado numbers versus time for the six Fujita-scale tornadoes:
 |
 |
 |
 |
 |
 |
 |
Going into this study I expected the number of high-Fujita tornadoes to increase with time due to global warming. As the graphs above show that expectation is not the case. Instead the number of low-Fujita tornadoes (F0 & F1) has greatly increased with time while the number of high-Fujita tornadoes (F2 to F5) has decreased with time, but the total number has increased.
It may be that more of the low-Fujita tornadoes have been reported in recent decades than were reported in the 1950s and 1960s.
To further check on this global warming hypothesis here is a plot of the number of tornadoes and the average Earth temperature:

The correlation coefficient, 0.75, is quite high. The probability appears to be quite high that the number of tornadoes increases as average Earth temperature increases.
The tornado vortex speed contributes to the energy released (power) by the square of the speed. The width and path length of the tornadoes are given, so I calculate relative energies of the different tornadoes by multiplying the volume traced out by the square of the speed and divided by 4000 to make the value manageably small; I assume that the height is the same for all tornadoes. I use the average speed for the Fujita Scale in the calculation. The result of this calculation is
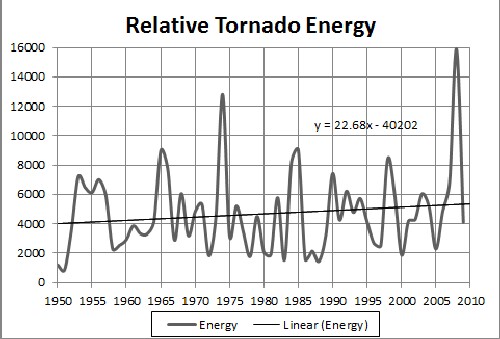
Going into this calculation I expected the tornado energy to increase with time due to global warming. That appears to be true, but not as much as I had expected.
To check on this global warming hypothesis here is a plot of the relative tornadoes' energy and the average Earth temperature:
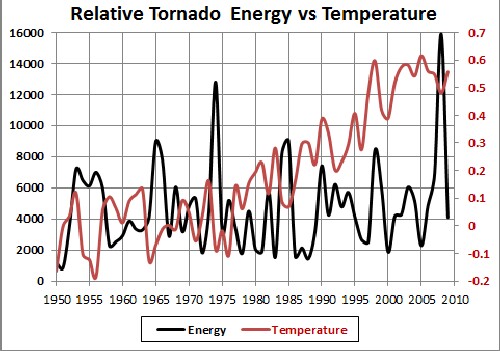
Visually there does not appear to be much correlation; in fact, the correlation coefficient is 0.015 or almost no correlation.
Another possible cause of increase in tornadoes is the oceanic Niño index (ONI), a measure of the El Niño/La Niña-Southern Oscillation (ENSO). Here is a plot of relative tornadoes energy along with the ONI:
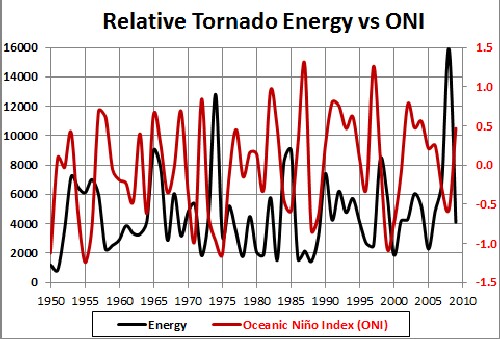
The correlation coefficient is -0.158, a slight anti-correlation.
It is interesting that there is a fairly high correlation of ONI with average Earth temperature:
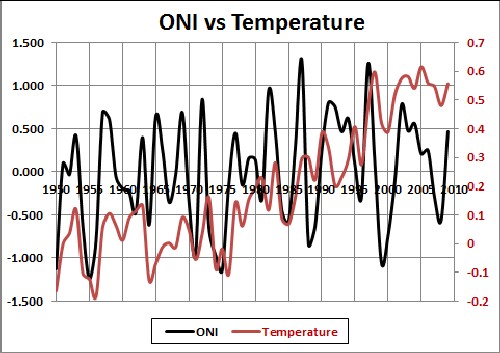
The correlation coefficient is 0.354. So it could be that global warming in enhancing the La Niña cooling part of the oceanic Niño oscillation which in turn is enhancing the occurrence of tornadoes.

The dotted line almost passes through my home town of Arnett OK, just below the Oklahoma panhandle.
As this picture shows the generation of tornadoes requires a cold air mass coming in from the NW to collide with a warm air mass coming in from the SE and warm dry air coming in from the SW. La Niña cooling in the Pacific can help supply the cold air mass.
It is reasonable to conclude that increasing average global temperature would cause tornadoes to occur more evenly over all twelve months of the year. So, I collected the data for each month of the years from 1950 to 2009. Linear fits to the monthly %-occurrence data versus year have the following slopes:
Linear Fits' slopes: |
|
Jan |
0.000117 |
Feb |
-0.000388 |
Mar |
-0.000120 |
Apr |
-0.000361 |
May |
-0.000081 |
Jun |
-0.000229 |
Jul |
-0.000137 |
Aug |
-0.000074 |
Sep |
0.000388 |
Oct |
0.000501 |
Nov |
0.000413 |
Dec |
-0.000029 |
Note that the months of September, October and November have the largest increasing slope and the months of April and June have the largest decreasing slope. This change from spring/summer months to fall months are seen here for decadal averages:
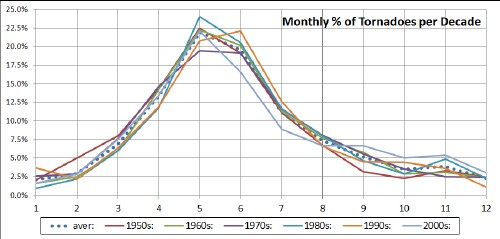
That is, the distribution of tornadoes over the twelve months is becoming slightly less peaked at May.
No correlation was observed between the average Earth temperature and the relative tornado energy, as crudely defined in this article. However, the correlation is high, 0.75, between the number of tornadoes and the average Earth temperature. It is highly likely that increasing Earth temperatures due to global warming will cause an increase in the number of tornadoes and cause more tornadoes to occur during fall months
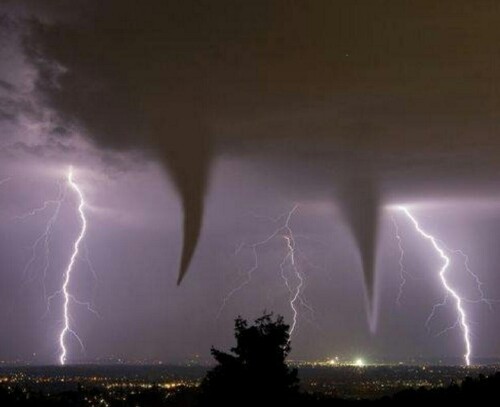 El Reno OK May 2013 |
 |
L. David Roper interdisciplinary studies
Roper Global Warming
L. David Roper, http://www.roperld.com/personal/roperldavid.htm
5 April, 2016