One can get quite different phylograms by using the Kitsch program instead of Neighbor. I use Neighbor because it gives results in better agreement with the Network program.
Go to Roper male-line
Y-chromosome project web page.
Little/Klein/Cline/Kline Genetics Project
Franklin Genetics Project
Because of other time commitments, I will not be analyzing any more Y-markers.
The results of the three Y-chromosome projects I am running can be seen by the links at http://www.roperld.com/genetics.htm. Several other project that are underway using the services of the company Family Tree DNA can be seen by the links athttp://www.familytreedna.com/surname.html. A list of many Y-chromosome projects is: http://freepages.genealogy.rootsweb.com/~allpoms/genetics1a.html.
I have used the results for those FTDNA projects that have published the 25-marker results on the Internet or sent them to me to compared them by calculating their "relative mutations",
often called "genetic distance." This is just the sum of the number of relative mutations in the 25 positions.
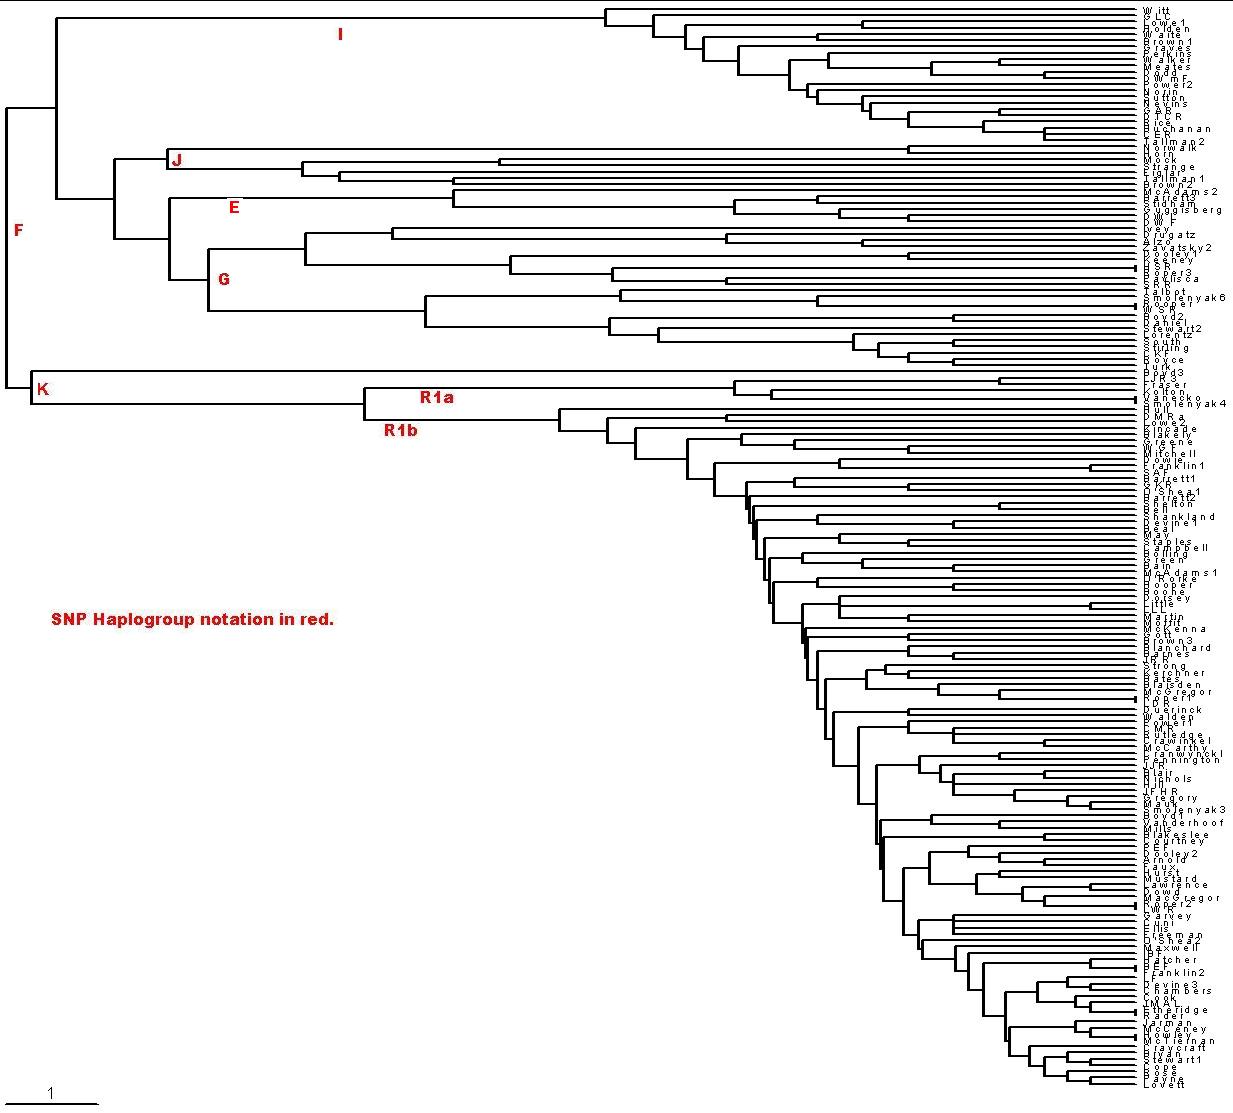
A way to visualize the relationships among the families is by a time-ordered (rooted tree) phylogram calculated from relative-mutations matrices. To create time-ordered phylograms, I use the PHYLIP/Neighbor software using the relative-mutations matrix to generate a tree file (*.tre) to be plotted by the TreeView software. (For a description of how I do it, see PHYLIPTreeViewUse.htm.)
One can use the relative mutations to create a time-ordered (rooted-tree) phylogram, which shows how the families evolved in time:
One can get quite different phylograms by using the Kitsch program instead of Neighbor. I use Neighbor because it gives results in better agreement with the Network program. |
| I used only the first 21 of the 25 markers for 170
families because of some uncertainties about how
to include the four DYS464 markers. (Only 142 of them are shown in the plot.) The scale at the bottom left indicates the horizontal distance for 1 mutation from the common ancestor. Vertical distances indicate connections. |
||||||||||||||||||
| From the SNP Y-chromosome notation in http://ycc.biosci.arizona.edu/nomenclature_system/fig1.html for Single-Nucleotide Polymorphisms (SNP), I estimate the nine SNP mutations back to the most recent common ancestor in Africa to be about 6000 years per SNP mutation, using 50,000 years as the time Homo sapiens sapiens left Africa. There are seven mutations back to the F haplogroup's most recent common ancestor (MRCA) for the Roper/Raper testees, or about 39,000 years. Since there are 7 SNP mutations and 14 STR mutations back to the F haplogroup MCRA, at first thought it would appear that the STR mutations per chromosome over long times happen about twice as fast as the SNP mutations. Thus, for long times into the past, each STR mutation is about 2800 years. The time back to the R1b MRCA is about 7 STR mutations times 2800, or 19,600 years, in the last glacial maximum. (Bryan Sykes, on p. 143 in his book, Adam's Curse, a Future Without Men, states that one should not use raw STR mutation rates to try to relate males who are in different SNP haplogroups. This is because, for males so distantly related, some of the markers could have mutated both positive and negative.) | ||||||||||||||||||
| Note that there are two major divisions of the families between
Stirling and Boyd3 about a third of the way down. The upper set has 33% of the
170 families in it. The upper set has two major divisions between Tallman2 and
Norwalk; 36% of the upper families are in the top set, 12% of the total 170
families. Some major events in and around Europe must have caused these genetic
differences between the three sets of families. See below for estimates of the
time for the founding fathers of the three groups. If one considers Boyd3 as in
error or an outlier family in some other way, the second group down (from
Norwalk down to Stirling) is the older group in Europe; that is, it came into
Europe first. I call this group G1. The next oldest group in Europe is the
bottom group of families, 67% of the 170 families. Although it came into Europe
later than G1, it must have come in in larger numbers. I call this group G2.
The top group of families came into Europe even later; I call it G3. So we have:
|
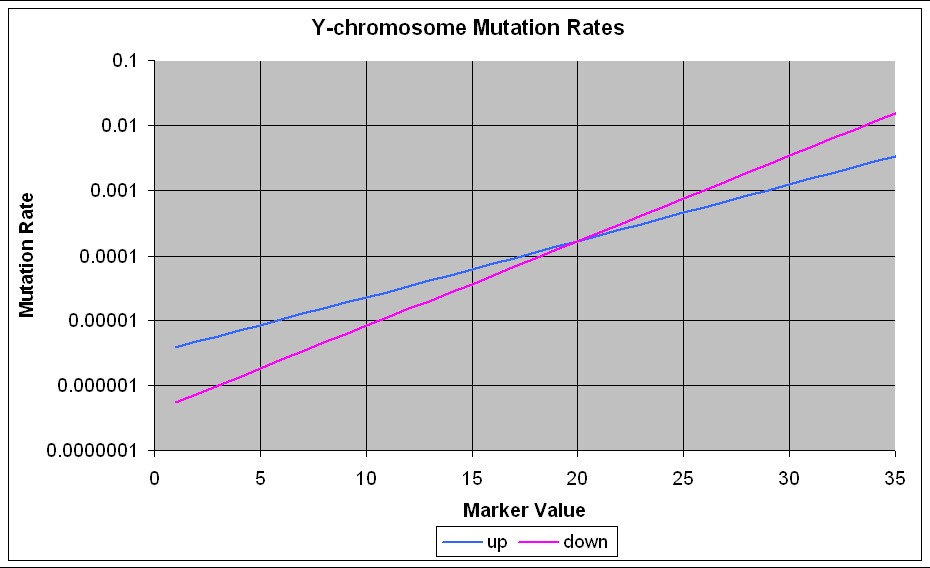
The paper (http://www.genetics.org/cgi/content/full/164/2/781) mentioned above shows that the mutation rates are different for increases and decreases in marker value. The equations for the mutation rates for increasing and decreasing a marker value, taken from that paper, are
The following graph shows the mutation rates for up and down mutations for different marker values:
 |
For the 154 families studied on this web page, the average values of the markers for the Family Tree DNA 25 markers and the calculated mutation rates are:
| 154 families | Y marker | 393 | 390 | 19(394) | 391 | 385a | 385b | 426 | 388 | 439 | 389-1 | 392 | (389-2)-(389-1) | 458 | 459a | 459b | 455 | 454 | 447 | 437 | 448 | 449 | 464a | 464b | 464c | 464d |
| Average | 13 | 24 | 14 | 10 | 12 | 15 | 12 | 12 | 12 | 13 | 13 | 16 | 17 | 9 | 10 | 11 | 11 | 25 | 15 | 19 | 30 | 15 | 16 | 17 | 18 | |
| Mutation rate | down | 2.03E-05 | 5.62E-04 | 2.74E-05 | 8.20E-06 | 1.50E-05 | 3.71E-05 | 1.50E-05 | 1.50E-05 | 1.50E-05 | 2.03E-05 | 2.03E-05 | 5.02E-05 | 6.79E-05 | 6.06E-06 | 8.20E-06 | 1.11E-05 | 1.11E-05 | 7.60E-04 | 3.71E-05 | 1.24E-04 | 3.44E-03 | 3.71E-05 | 5.02E-05 | 6.79E-05 | 9.18E-05 |
| up | 4.17E-05 | 3.77E-04 | 5.10E-05 | 2.29E-05 | 3.42E-05 | 6.23E-05 | 3.42E-05 | 3.42E-05 | 3.42E-05 | 4.17E-05 | 4.17E-05 | 7.61E-05 | 9.29E-05 | 1.88E-05 | 2.29E-05 | 2.80E-05 | 2.80E-05 | 4.60E-04 | 6.23E-05 | 1.39E-04 | 1.25E-03 | 6.23E-05 | 7.61E-05 | 9.29E-05 | 1.13E-04 |
The average mutation rates for the 25 markers used by Family Tree DNA are:
| Mutation Direction | Mutation Rate |
| down | 0.000221 |
| up | 0.000132 |
| average | 0.000176 |
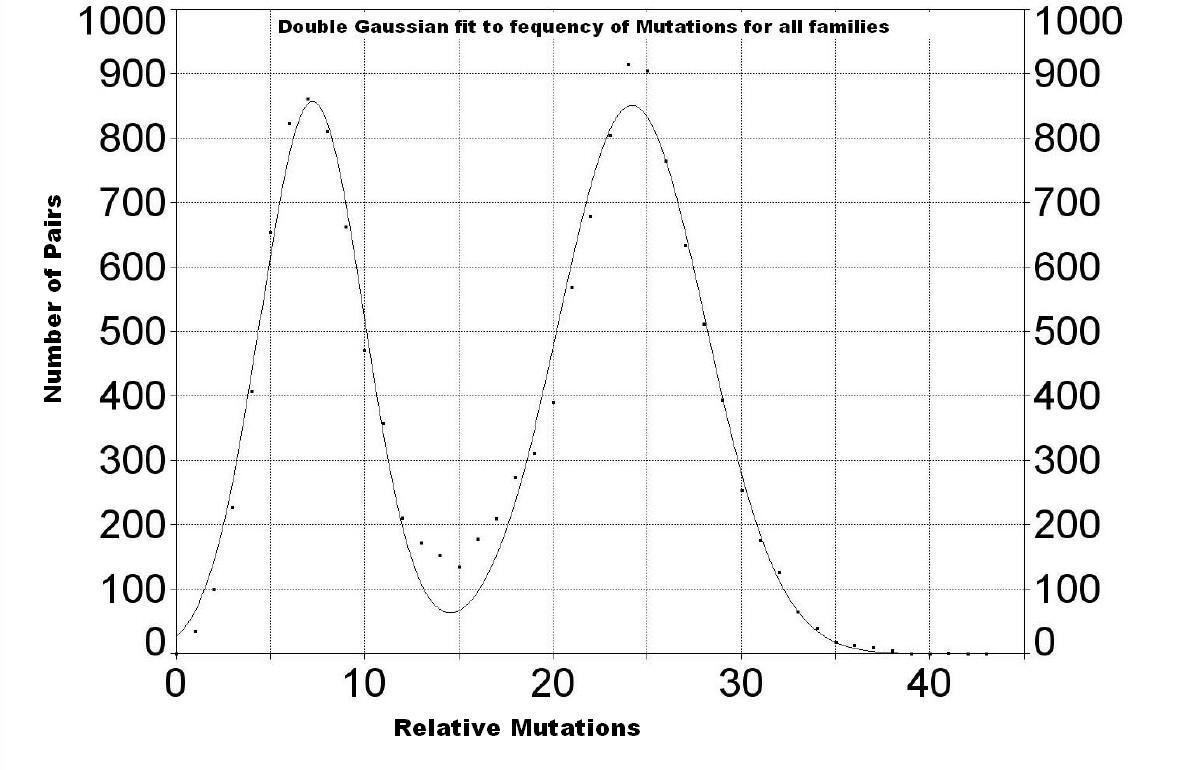
If there are enough families in a group of families that has been expanding rapidly from a founder, one can gain some information about that expansion by plotting the frequency of relative mutations; i.e., the number of pairs that have particular relative mutations:
 |
|
| One expects to see a bell-shaped curve if
the sample of families is large, random and expanding rapidly. (See The Journey of Man, A Genetic Odessey by Spencer
Wells, p.91.) We see two nearly bell-shaped (Gaussian) peaks with peaks at 7.2
± 2.8 and 24.2 ± 3.9 relative mutations. The first peak is almost
entirely due to Group 2 (see below). Group 3 has a very small peak hidden under
the first peak (see below). The small peak for Group 1 (see below), the oldest
group, is hidden under the second peak. The fact that the location of the second peak is larger than the first peak implies that the relative mutations between Group 2 and the other two Groups indicates a common ancestor at the peak value. One can improve the fit to the data by including another Gaussian peak between these two peaks, which corresponds with a peak for Group 1 shown next. |
|
| The following three graphs show the frequency of mutations for the three groups. | |
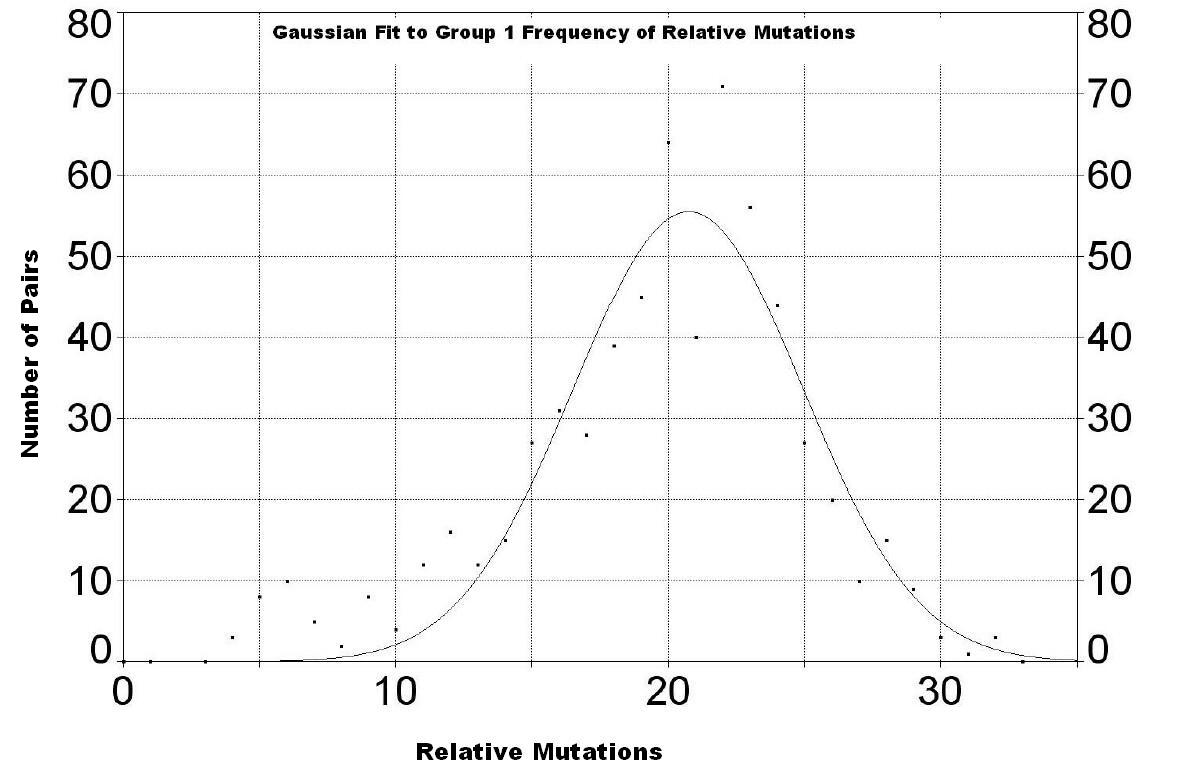 More data are needed for families in this group to make the curve smoother. The peak appears to be at about 20.7 ± 4.2 relative mutations. |
|
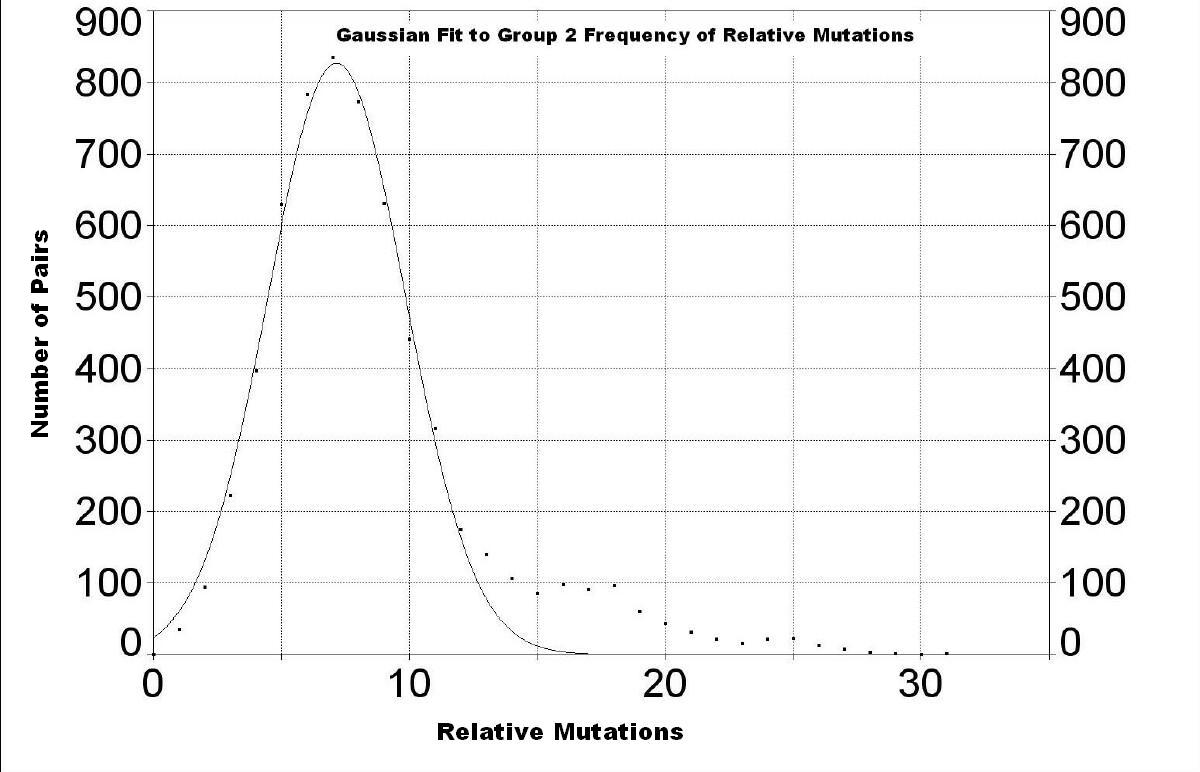 The peak is at 7.2 ± 2.7 relative mutations. |
|
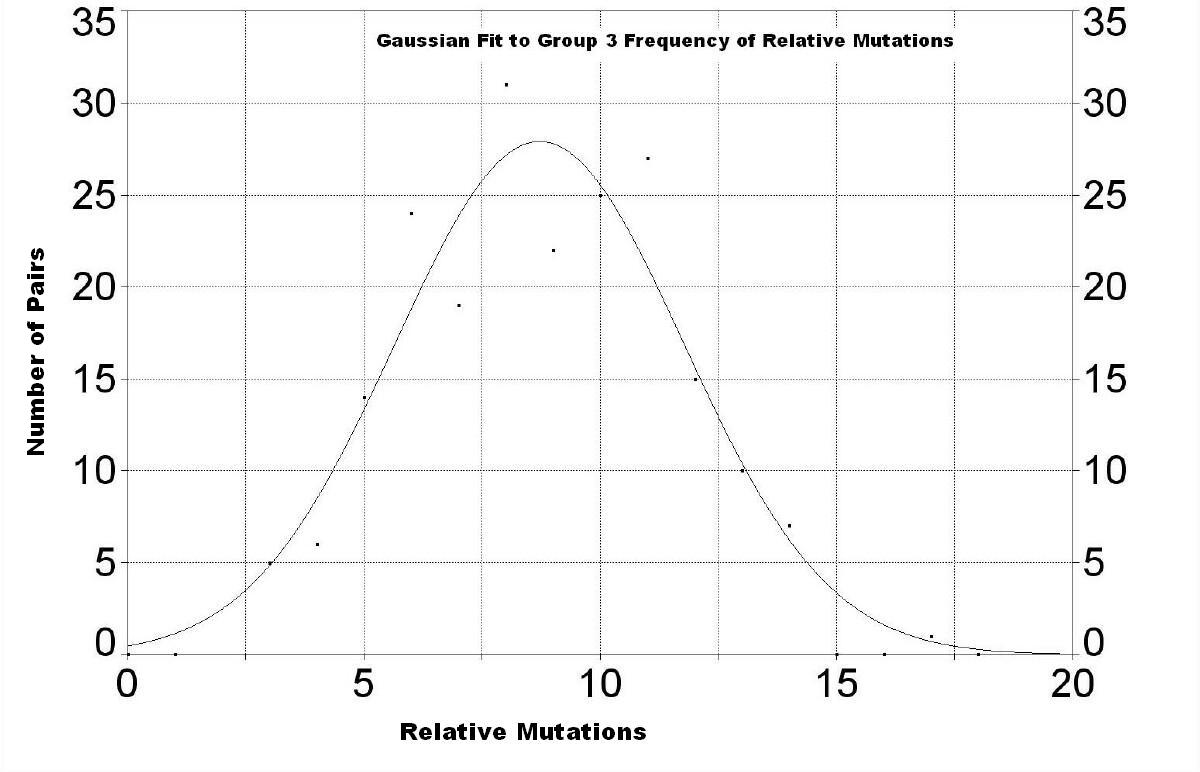 More data are needed for families in this group to make the curve smoother. The peak appears to be at about 8.7 ± 3.1 relative mutations. This curve is hidden under the much larger curve for Group 2 in the graph above for all families. |
One can compare the medians for markers for the three groups:
| Marker Name (prefix DYS) |
393 | 390 | 19(394) | 391 | 385a | 385b | 426 | 388 | 439 | 389-1 | 392 | (389-2)- (389-1) | 458 | 459a | 459b | 455 | 454 | 447 | 437 | 448 | 449 | 464a | 464b | 464c | 464d |
| Group 1 | 14 | 23 | 15 | 10 | 15 | 16 | 11 | 13 | 11 | 13 | 11 | 17 | 16 | 8 | 9 | 11 | 11 | 25 | 14 | 20 | 30 | 13 | 15 | 16 | 16 |
| Group 2 | 13 | 24 | 14 | 11 | 11 | 14 | 12 | 12 | 12 | 13 | 13 | 16 | 17 | 9 | 10 | 11 | 11 | 25 | 15 | 19 | 29 | 16 | 16 | 18 | 18 |
| Group 3 | 13 | 23 | 14 | 10 | 14 | 14 | 11 | 14 | 11 | 12 | 11 | 16 | 15 | 8 | 9 | 8 | 11 | 23 | 16 | 20 | 29 | 13 | 15 | 16 | 17 |
| Maximum- Minimum |
1 | 1 | 1 | 1 | 4 | 2 | 1 | 2 | 1 | 1 | 2 | 1 | 2 | 1 | 1 | 3 | 0 | 2 | 2 | 1 | 1 | 3 | 1 | 2 | 2 |
Note that the three markers with the greatest differences are DYS385a (4), DYS455 (3) and DYS464a (3). When data for a new family becomes available, I use these three markers to decide to which of the three families it belongs. Of course, one can also do a relative-mutations calculation with the markers for a new family and the three groups.
The relative mutations for these groups are:
| Relative Mutations |
Group 1 | Group 2 | Group 3 |
| Group 1 | 0 | ||
| Group 2 | 22 | 0 | |
| Group 3 | 17 | 23 | 0 |
So, Group 1 and Group 3 (17 relative mutation) are more closely related than are Group 1 and Group 2 (22 relative mutations) or Group 2 and Group 3 (23 relative mutations).
Family Tree DNA can now determine the haplogroup for a male according to the latest nomenclature for haplogroups. I have had mine done and some others have informed me of theirs. Here are the ones I know so far:
| Markers (prefix DYS) | ||||||||||||||||||||||||||
| Name | Haplogroup | 393 | 390 | 19(394) | 391 | 385a | 385b | 426 | 388 | 439 | 389a | 392 | 389b | 458 | 459a | 459b | 455 | 454 | 447 | 437 | 448 | 449 | 464a | 464b | 464c | 464d |
| Roper (LDR) | R1b | 13 | 24 | 14 | 10 | 11 | 16 | 12 | 12 | 12 | 13 | 13 | 17 | 16 | 9 | 10 | 11 | 11 | 25 | 15 | 19 | 30 | 15 | 16 | 16 | 17 |
| Talbot | E3a | 14 | 22 | 15 | 11 | 17 | 18 | 11 | 12 | 13 | 13 | 11 | 17 | 17 | 8 | 10 | 11 | 11 | 25 | 14 | 21 | 29 | 14 | 17 | 18 | 18 |
| Stidham | E3b | 13 | 24 | 13 | 10 | 16 | 18 | 11 | 12 | 12 | 13 | 11 | 16 | 15 | 9 | 9 | 11 | 11 | 25 | 14 | 21 | 31 | 15 | 17 | 18 | 18 |
The paper http://evolutsioon.ut.ee/publications/Tambets2004.pdf gives some Y-haplogroup percentages for some regions and populations(p.7).
The following table shows the relative mutations for some families for which 37 markers have been measured:
| Relative Mutations |
37 Markers |
LDR | WAR | SR | IBF | CMF | JEF | BF | JMAL | TNL | Davnpt9415 | Davnpt8666 | Davnpt7181 | Davnpt7505 | Davnpt11950 | Davnpt11382 | Davnpt11596 | Sutton4933 | Sutton4141 | Duerinck281 | Arnold6078 | Ivey7724 | Ivey10521 | Ivy10541 | Ivie8367 | Ivy13261 | Ivey7362 | Ivy8355 | Ivey10508 | Hurst10507 | Hurst1370 | Hurst3131 | Hurst8764 | Hurst13991 | Bricker | |
| 1 | LDR | 0 | LDR | |||||||||||||||||||||||||||||||||
| 2 | WAR | 1 | 0 | WAR | ||||||||||||||||||||||||||||||||
| 3 | SR | 12 | 11 | 0 | SR | |||||||||||||||||||||||||||||||
| 4 | IBF | 15 | 16 | 12 | 0 | IBF | ||||||||||||||||||||||||||||||
| 5 | CMF | 14 | 15 | 11 | 1 | 0 | CMF | |||||||||||||||||||||||||||||
| 6 | JEF | 13 | 14 | 12 | 2 | 1 | 0 | JEF | ||||||||||||||||||||||||||||
| 7 | BF | 15 | 16 | 12 | 2 | 1 | 2 | 0 | BF | |||||||||||||||||||||||||||
| 8 | JMAL | 7 | 8 | 15 | 16 | 15 | 14 | 14 | 0 | JMAL | ||||||||||||||||||||||||||
| 9 | TNL | 34 | 35 | 34 | 32 | 31 | 32 | 30 | 33 | 0 | TNL | |||||||||||||||||||||||||
| 10 | Dv9415 | 14 | 13 | 16 | 12 | 11 | 10 | 12 | 15 | 31 | 0 | Dv9415 | ||||||||||||||||||||||||
| 11 | Dv8666 | 16 | 15 | 16 | 14 | 13 | 12 | 14 | 17 | 33 | 2 | 0 | Dv8666 | |||||||||||||||||||||||
| 12 | Dv7181 | 15 | 14 | 17 | 11 | 10 | 11 | 11 | 16 | 32 | 3 | 3 | 0 | Dv7181 | ||||||||||||||||||||||
| 13 | Dv7505 | 15 | 14 | 17 | 11 | 10 | 11 | 11 | 16 | 32 | 3 | 3 | 0 | 0 | Dv7505 | |||||||||||||||||||||
| 14 | Dv11950 | 14 | 13 | 16 | 10 | 9 | 10 | 10 | 15 | 31 | 3 | 5 | 2 | 2 | 0 | Dv11950 | ||||||||||||||||||||
| 15 | Dv11382 | 16 | 15 | 20 | 14 | 13 | 12 | 14 | 17 | 35 | 5 | 5 | 4 | 4 | 4 | 0 | Dv11382 | |||||||||||||||||||
| 16 | Dv11596 | 19 | 18 | 15 | 17 | 16 | 17 | 17 | 16 | 38 | 15 | 17 | 16 | 16 | 16 | 20 | 0 | Dv11596 | ||||||||||||||||||
| 17 | Sut4933 | 46 | 47 | 45 | 46 | 45 | 46 | 46 | 45 | 45 | 45 | 45 | 46 | 46 | 45 | 47 | 48 | 0 | Sut4933 | |||||||||||||||||
| 18 | Sut4141 | 46 | 47 | 45 | 46 | 45 | 46 | 46 | 45 | 45 | 45 | 45 | 46 | 46 | 45 | 47 | 48 | 0 | 0 | Sut4141 | ||||||||||||||||
| 19 | Drk281 | 11 | 12 | 16 | 13 | 12 | 11 | 13 | 16 | 38 | 15 | 17 | 16 | 16 | 16 | 18 | 18 | 50 | 50 | 0 | Drk281 | |||||||||||||||
| 20 | Ard6078 | 14 | 15 | 18 | 14 | 13 | 14 | 14 | 13 | 30 | 17 | 19 | 16 | 16 | 15 | 19 | 16 | 43 | 43 | 16 | 0 | Ard6078 | ||||||||||||||
| 21 | Ivey7724 | 39 | 40 | 45 | 48 | 47 | 48 | 48 | 46 | 46 | 44 | 44 | 43 | 43 | 43 | 45 | 49 | 42 | 42 | 41 | 39 | 0 | Ivey7724 | |||||||||||||
| 22 | Ivey10521 | 39 | 40 | 45 | 48 | 47 | 48 | 48 | 46 | 46 | 44 | 44 | 43 | 43 | 43 | 45 | 49 | 42 | 42 | 41 | 39 | 0 | 0 | Ivey10521 | ||||||||||||
| 23 | Ivy10541 | 40 | 41 | 46 | 49 | 48 | 49 | 49 | 47 | 47 | 45 | 45 | 44 | 44 | 44 | 46 | 50 | 43 | 43 | 42 | 40 | 1 | 1 | 0 | Ivy10541 | |||||||||||
| 24 | Ivie8367 | 39 | 40 | 45 | 46 | 45 | 46 | 46 | 46 | 46 | 44 | 44 | 43 | 43 | 43 | 45 | 49 | 42 | 42 | 39 | 37 | 2 | 2 | 3 | 0 | Ivie8367 | ||||||||||
| 25 | Ivy13261 | 38 | 39 | 44 | 47 | 46 | 47 | 47 | 45 | 45 | 43 | 43 | 42 | 42 | 42 | 44 | 48 | 41 | 41 | 40 | 38 | 1 | 1 | 2 | 3 | 0 | Ivy13261 | |||||||||
| 26 | Ivey7362 | 38 | 39 | 44 | 47 | 46 | 47 | 47 | 45 | 45 | 43 | 43 | 42 | 42 | 42 | 44 | 48 | 43 | 43 | 40 | 40 | 3 | 3 | 2 | 5 | 2 | 0 | Ivey7362 | ||||||||
| 27 | Ivy8355 | 39 | 40 | 45 | 48 | 47 | 48 | 48 | 46 | 44 | 44 | 44 | 43 | 43 | 43 | 45 | 49 | 42 | 42 | 41 | 39 | 4 | 4 | 3 | 6 | 3 | 3 | 0 | Ivy8355 | |||||||
| 28 | Ivey10508 | 30 | 31 | 33 | 32 | 31 | 32 | 30 | 31 | 20 | 29 | 31 | 30 | 30 | 29 | 33 | 36 | 47 | 47 | 32 | 28 | 40 | 40 | 39 | 40 | 39 | 37 | 38 | 0 | Ivey10508 | ||||||
| 29 | Hurst10507 | 17 | 18 | 22 | 21 | 20 | 21 | 21 | 16 | 38 | 21 | 21 | 20 | 20 | 20 | 24 | 20 | 42 | 42 | 20 | 18 | 43 | 43 | 44 | 43 | 42 | 44 | 43 | 38 | 0 | Hurst10507 | |||||
| 30 | Hurst1370 | 14 | 15 | 19 | 18 | 17 | 18 | 18 | 13 | 35 | 18 | 18 | 17 | 17 | 17 | 21 | 17 | 39 | 39 | 17 | 15 | 40 | 40 | 41 | 40 | 39 | 41 | 40 | 35 | 3 | 0 | Hurst1370 | ||||
| 31 | Hurst3131 | 14 | 15 | 19 | 18 | 17 | 18 | 18 | 13 | 35 | 18 | 18 | 17 | 17 | 17 | 21 | 17 | 39 | 39 | 17 | 15 | 40 | 40 | 41 | 40 | 39 | 41 | 40 | 35 | 3 | 0 | 0 | Hurst3131 | |||
| 32 | Hurst8764 | 14 | 15 | 19 | 18 | 17 | 18 | 18 | 13 | 35 | 18 | 18 | 17 | 17 | 17 | 21 | 17 | 39 | 39 | 17 | 15 | 40 | 40 | 41 | 40 | 39 | 41 | 40 | 35 | 3 | 0 | 0 | 0 | Hurst8764 | ||
| 33 | Hurst13991 | 13 | 14 | 18 | 19 | 18 | 19 | 19 | 14 | 36 | 19 | 19 | 18 | 18 | 18 | 22 | 18 | 40 | 40 | 16 | 16 | 39 | 39 | 40 | 39 | 38 | 40 | 39 | 36 | 4 | 1 | 1 | 1 | 0 | Hurst13991 | |
| 34 | Bricker | 15 | 16 | 22 | 10 | 11 | 12 | 12 | 18 | 35 | 15 | 17 | 14 | 14 | 13 | 17 | 24 | 44 | 44 | 17 | 19 | 48 | 48 | 47 | 46 | 47 | 45 | 46 | 30 | 21 | 20 | 20 | 20 | 21 | 0 | Bricker |
| LDR | WAR | SR | IBF | CMF | JEF | BF | JMAL | TNL | Dv9415 | Dv8666 | Dv7181 | Dv7505 | Dv11950 | Dv11382 | Dv11596 | Sut4933 | Sut4141 | Drk281 | Ard6078 | Ivey7724 | Ivey10521 | Ivy10541 | Ivie8367 | Ivy13261 | Ivey7362 | Ivy8355 | Ivey10508 | Hurst10507 | Hurst1370 | Hurst3131 | Hurst8764 | Hurst13991 | Bricker |
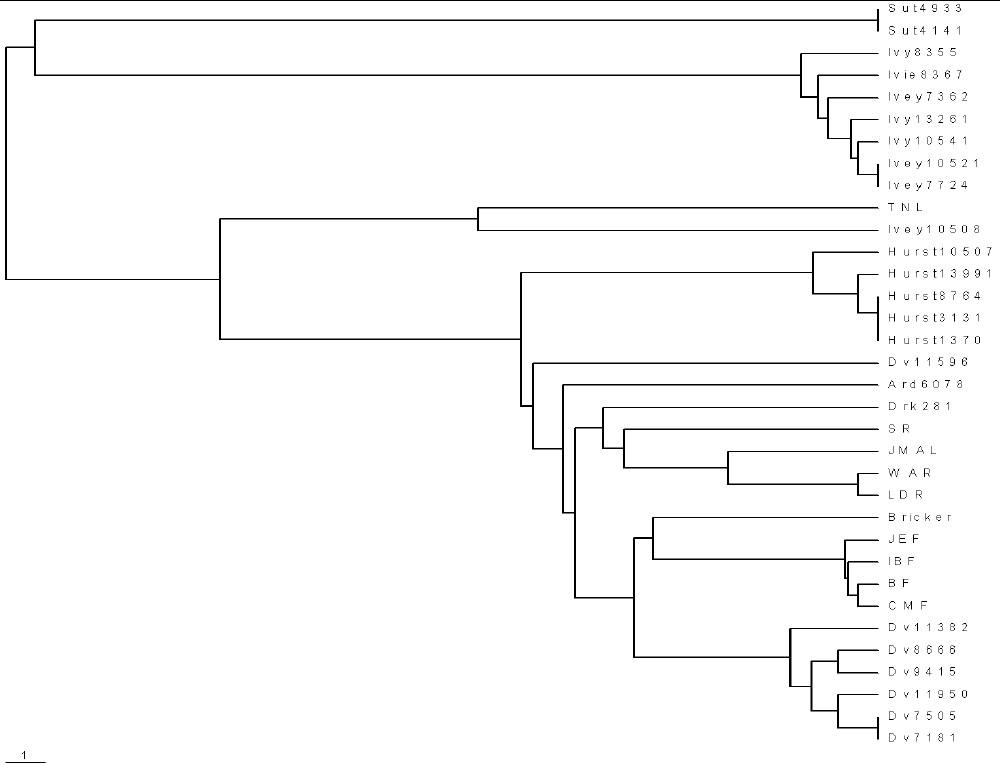
| This is a phylogram for the families with 37 markers: |
 |
I have data for enough families now to see the general pattern of European families.
Because of other time commitments, I will not be analyzing any more Y-markers.
Go to Roper male-line
Y-chromosome project web page.
Little/Klein/Cline Genetics Project
Franklin Genetics Project