The Solar Future
Why Solar Energy Must Run the World
L. David Roper
http://www.roperld.com/personal/roperldavid.htm
06-Apr-2016
Contents
Introduction
Humans have changed from using solar energy (sunshine, biomass, wind, tides, etc.) to fossil-fuels (coal, crude oil, natural gas) energy over the last few centuries. While solar energy will be available for millions of years, fossil fuels will be available for only a few centuries. Within the next few decades fossil-fuels extraction will peak and then humans will be forced to turn back to solar energy.
Modern human civilization has been organized around the availablity of massive amounts of fossil fuels. Therefore, when fossil fuels peak in availability there may be drastic effects on the viability of the institutions of civilization. Even though about half or somewhat more of the fossil fuels will remain to be extracted from the Earth at peak extraction, the declining rate of extraction will have large effects.
In this article I examine fossil-fuels extraction; showing when they are expected to peak in extraction.
I also examine uranium extraction; showing that it cannot replace dwindling fossil fuels as an energy source.
Therefore, within the next century human civilization will only have solar energy, in its various forms, to power its existence. So, I study how fast the various forms of solar energy are coming into play and make approximate projections into the future.
Fossil-Fuels Extraction
Fits to the fossil-fuels extraction data are obtained using the Verhulst function.
Crude Oil
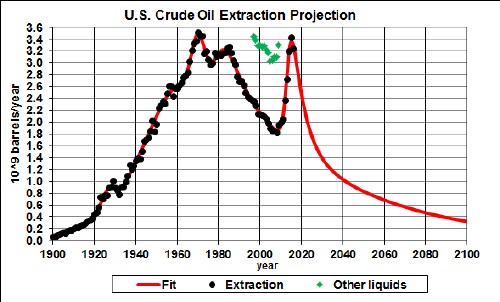
The green points include other hydrocarbon liquids besides crude oil; e.g., biodiesel and ethanol which are produced from plants. |
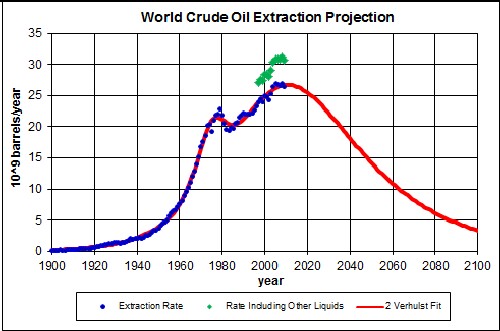
The green points include other hydrocarbon liquids besides crude oil; e.g., biodiesel and ethanol which are produced from plants. The amount of crude oil to be finally extracted (~2.50x10¹² barrels), the area under the curve, is the sum of what has already been extracted (~1.11x10¹² barrels) and the estimated world reserves, ~1.354x10¹² barrels.
|
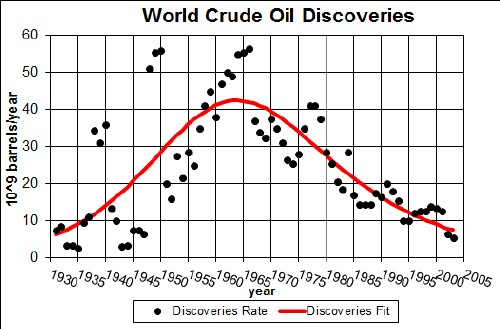
This Verhulst fit to the discovery data is for amount to be extracted of 1.957x10¹² barrels, about 0.5x10¹² barrels less than the amount for the fit to the extraction data. The discoveries data are not as reliable as the extraction data because it is difficult to extimate the amount still left in the ground.
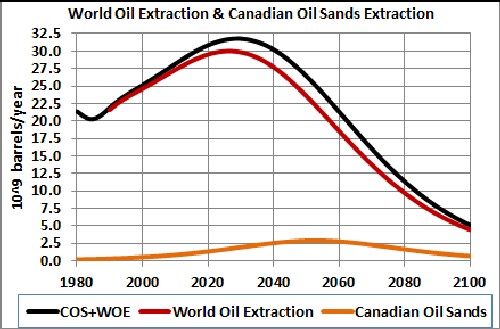
World-crude-oil extraction with Canadian-oil-sands extraction added. Are the extreme environmental costs worth the small bump in extraction? |
"Other liquids" in these graphs is defined as the natural gas plant liquids, and other liquids, and refinery processing gain (loss); e.g., biodiesel, ethanol, liquids produced from coal and oil shale.
Go to top.
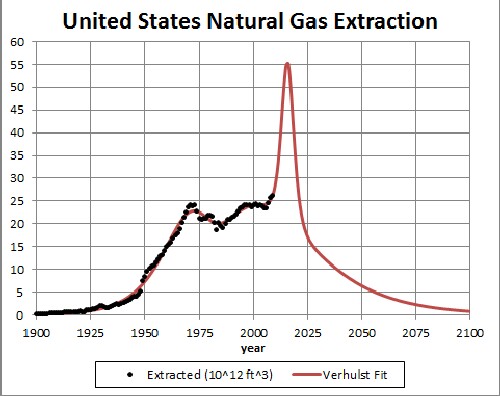
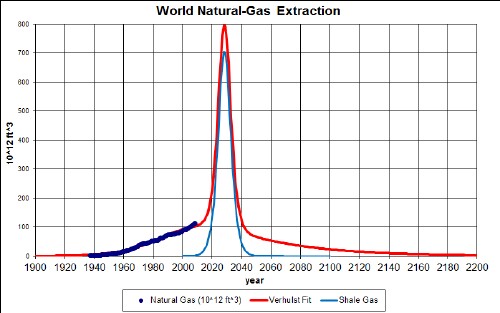
Natural Gas
Coal
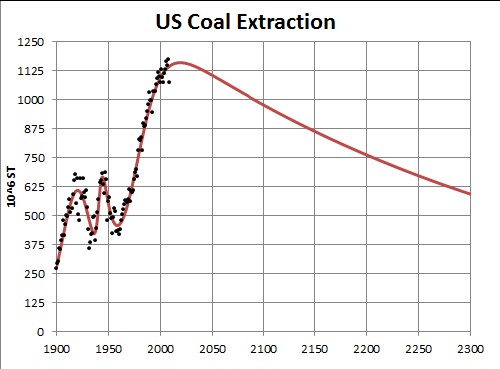
The amount to be finally extracted (565x109 short tons), the area under the curve, is the sum of what has already been extracted (~75x109 short tons) and the estimated U.S. reserves, 488x109 short tons.
|
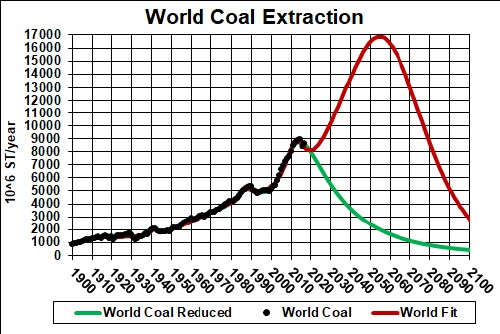
The amount to be finally extracted (1300x109 short tons), the area under the curve, is the sum of what has already been extracted (~350x109 short tons) and the estimated world reserves, 930x109 short tons.
There are some indications that the estimated reserves value is too high; if that is so, the peak will occur sooner than 2050. |
Go to top.
Fossil-Fuels Conclusions
The United States
- The United States has been on the downslide for crude-oil extraction since ~1970 and imports most of the oil it consumes.
- The United States would be on the downslide for natural-gas extraction if it were not for the extraction of it from shale deposits, a very environmentally damaging procedure. It is unclear that the rapidly rising shale extraction can continue very long.
- Coal extraction for the United States is probably at or near its peak; it probably will decline slowly over the next several hundred years.
Therefore, the United States should be working feverishly to develop renewable sources of energy to use where fossil fuels are now used.
The World
- World crude-oil extraction is apparently peaking. Extraction from oil sands, a very environmentally damaging procedure, will add a small bulge on the downside.
- World natural-gas extraction will peak soon with a high spike near the peak due to extraction from shale deposits, a very environmentally damaging procedure.
- Coal extraction for the world will peak somewhere between 2025 and 2075, more likely lower than higher.
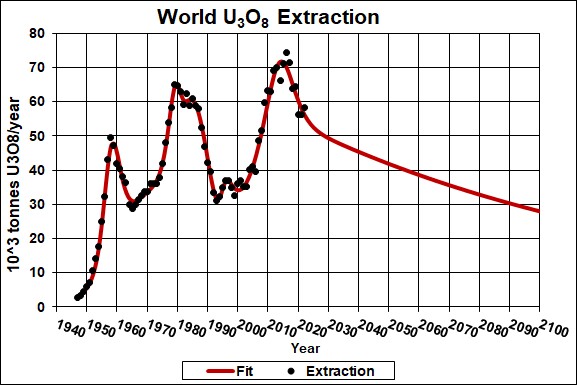
Uranium extraction rate for the World and Verhulst function fits to the data:
 5
5
The red curve is the best fit to the data; it has an eventual extraction amount of 3,967x103 tonnes.
I expect that there will be a large peak in uranium extraction in the next few decades as crude oil and natural gas extraction decline, followed by a possible sharp dip after a major nuclear-reactor accident or terrorism involving a nuclear reactor, and then a rise again to then follow the declining curve of uranium depletion.
Nuclear-Power Conclusions
Nuclear power is not a viable replacement for fossil fuels. Hopefully, the remaining uranium will be used to provide the energy needed to prepare the infrastructure for the solar future.
Go to top.
Wind Power
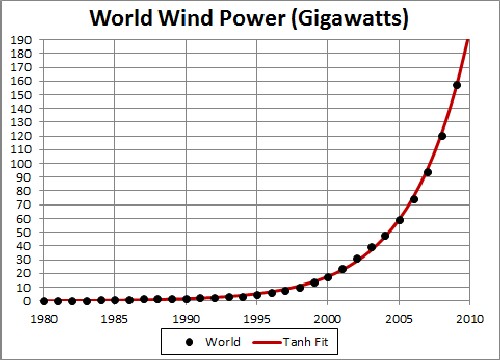
Wind power has been growing at about 28% each year in the twenty-first century. The countries where it has grown the fastest are the United States and China.
See Appendix 3 for the procedure for fitting data that approach an asymptote with a mathematical function.
Wind Power in the United States
National Offshore Wind Strategy
The fit yielded the results shown in the following graphs:
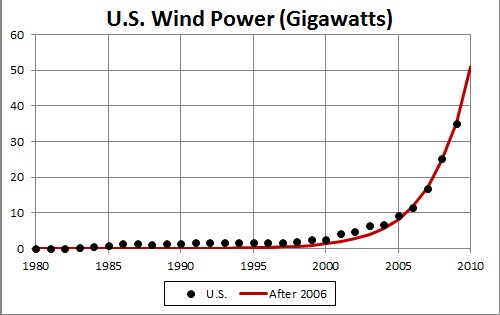
The fit is only to data since 2005 to capture the recent behavior. The unknown constant (asymptotic power) multiplying the function = 5000 gigawatts, tm = 2023 and w = 5.60 .
|
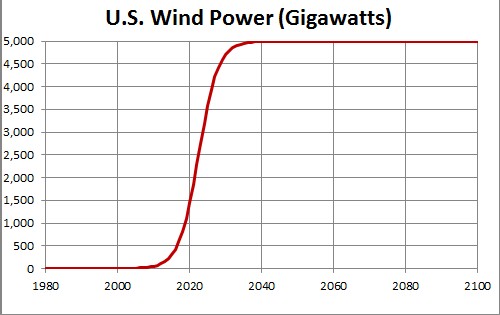
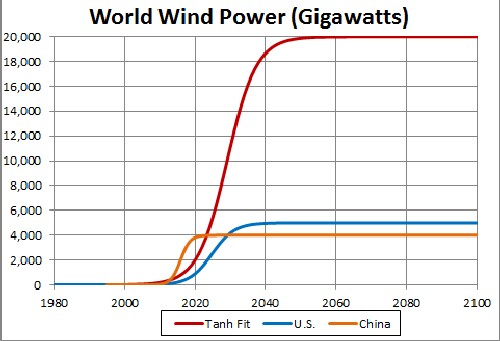
This shows a projection into the future. The asymptotic final power is unknown.
|
Since the currently available data are much below what the final power will be, the asymptotic power is very uncertain. 5000 gigawatts is probably a very conservative value for the asymptotic power.
|
Using the hyperbolic-tangent function for the fit assumes that the exponential slowing down into the asymptote has the same time constant as the rise from zero. Probably this will not be the case. When data are available after the middle point (tm), the following function would allow those two time constants to differ:
 .
.
Go to top.
Wind Power in Europe
The fit yielded the results shown in the following graphs:
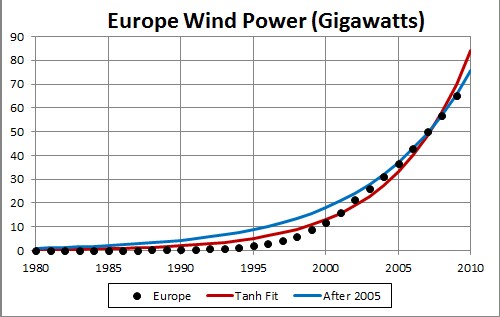
The arbitrary constant (asymptotic power) multiplying the function = 5000, tm = 2032 (2039 for After-2005 fit) and w = 10.63 (13.84 for After-2005 fit).
|
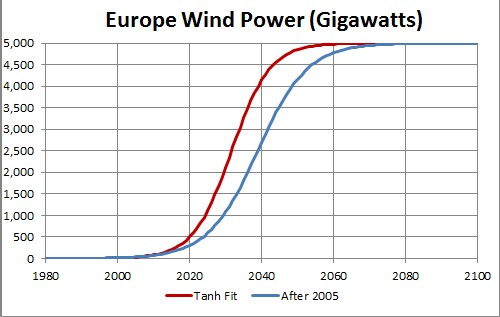
This shows a projection into the future. The asymptotic final power is unknown.
|
Since the currently available data are much below what the final power will be, the asymptotic power is very uncertain. 5000 gigawatts is probably a very conservative value for the asymptotic power.
|
Go to top.
Wind Power in China
The fit yielded the results shown in the following graphs:
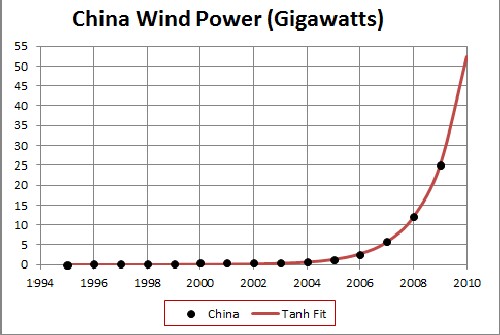
The unknown constant (asymptotic power) multiplying the function = 4000 gigawatts, tm = 2016 and w = 2.71 .
|
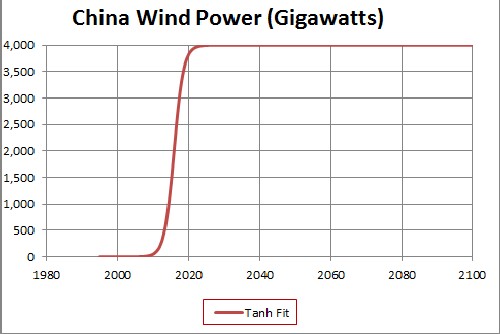
This shows a projection into the future. The asymptotic final power is unknown.
|
Since the currently available data are much below what the final power will be, the asymptotic power is very uncertain. 4000 gigawatts is probably a very conservative value for the asymptotic power.
|
Go to top.
Wind Power for the World
The fit yielded the results shown in the following graphs:
The unknown constant (asymptotic power) multiplying the function = 20,000 gigawatts, tm = 2029 and w = 8.28 .
|
This shows a projection into the future. The asymptotic final power is unknown.
|
Since the currently available data are much below what the final power will be, the asymptotic power is very uncertain. 20,000 gigawatts may be a conservative value for the asymptotic power.
|
Wind-Power Conclusions
Comparison of exponential time constants for wind power:
United States |
Europe |
China |
World |
2.80 years |
~6 years |
1.36 years |
4.14 years |
Wind power is coming on very fast in many countries; in many cases annual installation exceeds the case for other energy systems. Storage for peak electricity consumption will be solved by vehicle-to-grid systems (see Denmark example), battery banks, pumped storage, flywheels, etc. Another way to get continuous power from wind is to connect many widely-spaced turbines (Atlantic Transmission Grid proposal for wind power).
Go to top.
Solar Photovoltaic Power
See Appendix 3 for the procedure for fitting data that approach an asymptote with a mathematical function.
Solar Photovoltaic Power in the United States
The fit yielded the results shown in the following graphs:
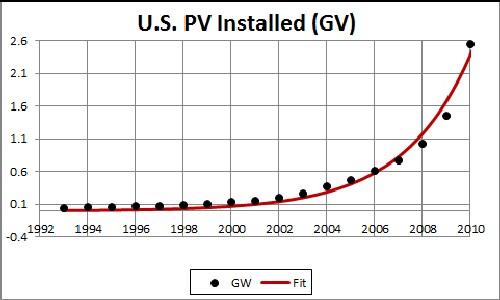
The unknown constant (asymptotic power) multiplying the function = 16,000 gigavolts, tm = 2035 and w = 5.68. |
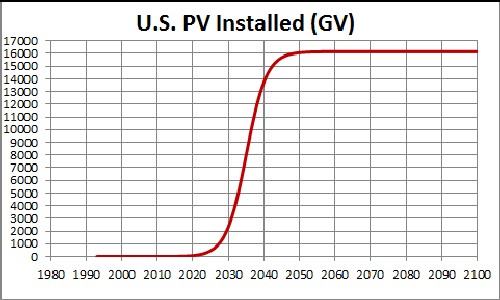
This shows a projection into the future. The asymptotic final power is unknown. |
Since the currently available data are much below what the final power will be, the asymptotic power is very uncertain. 16,000 gigavolts may be a conservative value for the asymptotic power. |
Go to top.
The fit yielded the results shown in the following graphs:
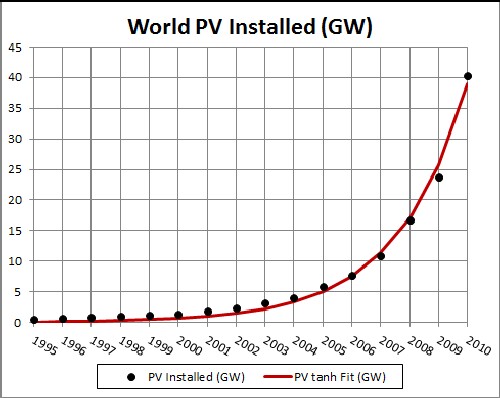
The unknown constant (asymptotic power) multiplying the function = 55,000 gigavolts, tm = 2028 and w = 4.85 . |
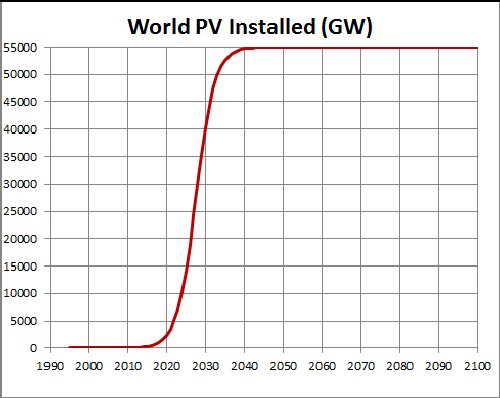
This shows a projection into the future. The asymptotic final power is unknown. |
Since the currently available data are much below what the final power will be, the asymptotic power is very uncertain. 55,000 gigavolts may be a conservative value for the asymptotic power.
|
Solar-Photovoltaic-Power Conclusions
Comparison of exponential time constants for solar photovoltaic power:
United States |
World |
2.34 years |
2.43 years |
Until recently the United States lagged behind the rest of the world in installing solar photovoltaic power. Now it appears to be catching up.
Go to top.
Biofuels Production
Data reference
See Appendix 3 for the procedure for fitting data that approach an asymptote with a mathematical function.
Biofuels Production in the United States
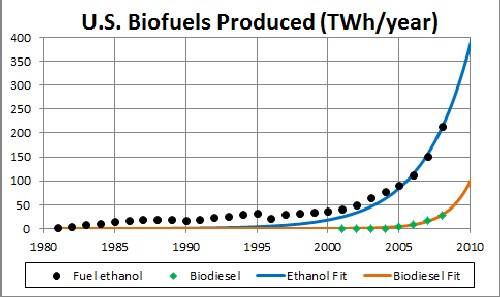
The fits are only to data since 2005 for ethanol and since 2000 for biodiesel to capture the most recent exponential behavior.
The unknown constant (asymptotic production) multiplying the function = 15,000 TWh/year, [tm = 2022 and w = 6.51 for ethanol] and [tm = 2018 and w = 3.21 for biodiesel]. |
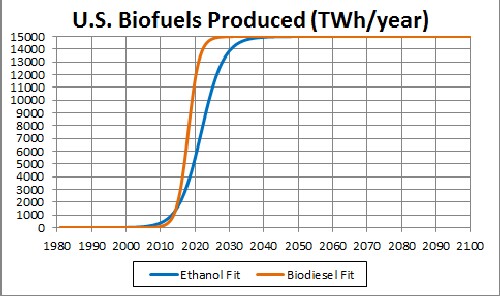
This shows a projection into the future. The asymptotic final production is unknown. |
| Since the currently available data are much below what the final power will be, the asymptotic power is very uncertain. 15,000 TWh/year may be a conservative value for the asymptotic power. |
Biofuels Production in Europe
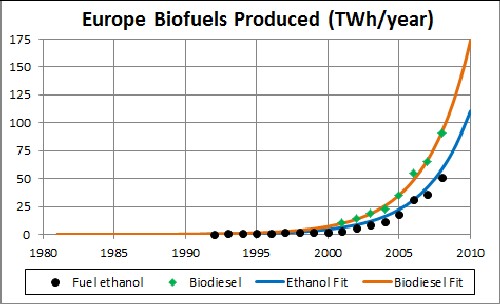
The unknown constant (asymptotic production) multiplying the function = 15,000 TWh/year, [tm = 2025 and w = 6.25 for ethanol] and [tm = 2024 and w = 6.25 for biodiesel].
|
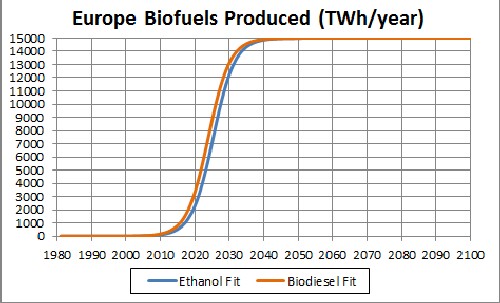
This shows a projection into the future. The asymptotic final production is unknown. |
| Since the currently available data are much below what the final power will be, the asymptotic power is very uncertain. 15,000 TWh/year may be a conservative value for the asymptotic power. |
Go to top.
Brazil is a very interesting case of fuel ethanol production:
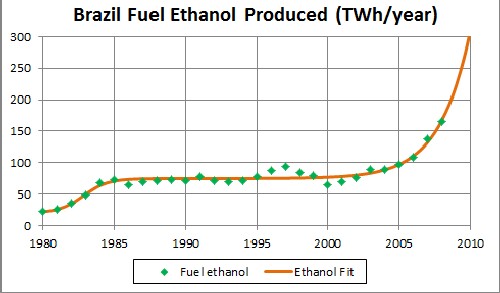
Here the fitting function is
 ,
,
where a = initial steady value, b = intermediate steady value and c = final steady value.
The first exponential time constant is 0.85 years and the second exponential time constant is 2.12 years.
Biodiesel Production in China
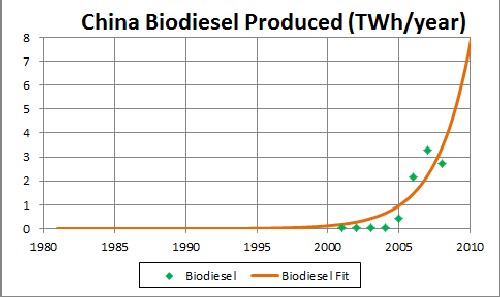
The exponential time constant is 2.40 years.
Biofuels Production for the World
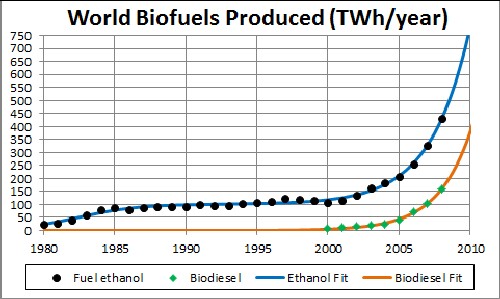
The first exponential time constant for fuel ethanol is 2.10 years and the second exponential time constant is 2.71 years. Most of the first plateau is Brazil's fuel ethanol production.
The unknown constant (asymptotic production) multiplying the function = 50,000 TWh/year, tm = 2021 and w = 4.63 for biodiesel. |
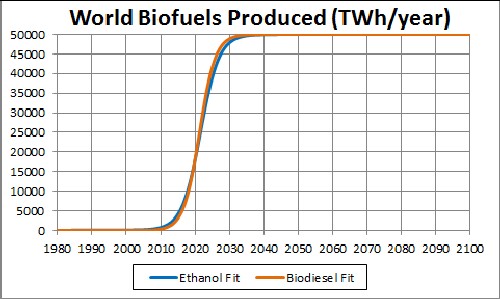
This shows a projection into the future. The asymptotic final production is unknown. |
| Since the currently available data are much below what the final power will be, the asymptotic power is very uncertain. 50,000 TWh/year may be a conservative value for the asymptotic power. |
Here the fitting function is
,
where a = initial steady value, b = intermediate steady value and c = final steady value.
Biofuels Production Conclusions
Comparison of exponential time constants for biofuels production:
|
United States |
Europe |
Brazil |
China |
World |
Fuel Ethanol |
3.26 years |
3.12 years |
2.12 years |
|
2.71 years |
Biodiesel |
1.61 years |
3.12 years |
|
2.40 years |
2.32 years |
Thus, the United States
- is moving into fuel ethanol slower than the rest of the world, mainly Brazil.
- is moving into biodiesel faster than the rest of the world, which surprised me.
Biodiesel appears to be the best fuel for transportation.
Go to top.
Renewable-Energy Conclusions
Comparison of exponential time constants for renewable energy:
|
United States |
Europe |
Brazil |
China |
World |
Wind |
2.80 years |
|
|
1.36 years |
4.14 years |
PV |
2.34 years |
|
|
|
2.43 years |
Fuel Ethanol |
3.26 years |
3.12 years |
2.12 years |
|
2.71 years |
Biodiesel |
1.61 years |
3.12 years |
|
2.40 years |
2.32 years |
In terms of % change per year (see Appendix 4):
|
United States |
Europe |
Brazil |
China |
World |
Wind |
42.9%/year |
|
|
108.6%/year |
27.3%/year |
PV |
50.8%/year |
|
|
|
42.2%/year |
Fuel Ethanol |
35.9%/year |
37.8%/year |
60.3%/year |
|
44.6%/year |
Biodiesel |
86.1%/year |
37.8%/year |
|
51.7%/year |
53.9%/year |
Thus, the United States
- is moving into using wind power faster than the rest of the world except for China.
- is moving into solar photovoltaic power (PV) about the same as the rest of the world.
- is moving into fuel ethanol slower than the rest of the world, mainly Brazil.
- is moving into biodiesel faster than the rest of the world.
As this article shows, the only long-term future for energy for human use is solar energy in its various forms. Getting to that future will not be easy. The burning of fossil fuels, which continues at a high pace, is placing the world in a long-term global warming phase. This global warming, as it progresses, will make it more difficult to use direct solar energy because of the increased moisture in the atmosphere as clouds, which prevent solar energy from being captured by collectors.
In the web page linked in the subsection title I assume that world energy consumption approaches an asymptote by year 2300 such that the per capita available power is 12 kW (350x106 BTU/person/year), about the per capita consumption for the United States now. (This assumes a population asymptote of about 8.3x10⁹.)
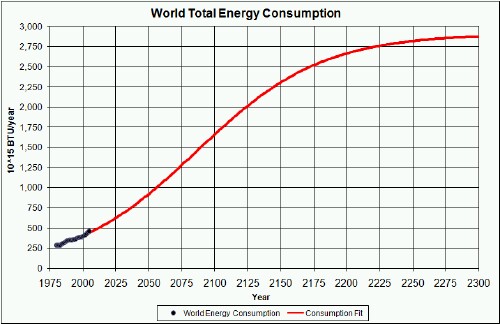
The graph below compares the world energy consumption to the total energy supplied by fossil fuels:
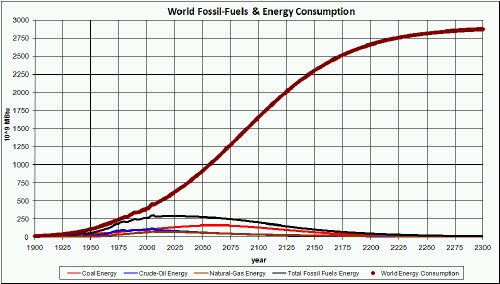
There is a huge energy deficit relative to fossil-fuels energy to meet the 350 MBTU/person asymptote.
The amount of energy that must be supplied by sources other than fossil fuels and uranium are shown in the graph below:
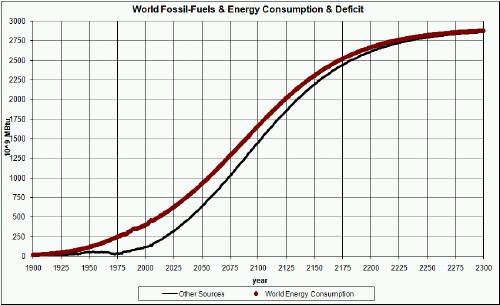
The referenced article goes on to show that continuing the rapid introduction of renewable energies that has been going on for the last several years is enough to fill in the gap.
Extraction: Minerals are extracted from the Earth, not "produced".
Lease condensate: A mixture consisting primarily of pentanes and heavier hydrocarbons which is recovered as a liquid from natural gas in lease separation facilities. This category excludes natural gas plant liquids, such as butane and propane, which are recovered at downstream natural gas processing plants or facilities.
Natural Gas Plant Liquids: Those hydrocarbons in natural gas that are separated as liquids at natural gas processing plants, fractionating and cycling plants, and, in some instances, field facilities. Lease condensate is excluded. Products obtained include ethane; liquefied petroleum gases (propane, butanes, propane-butane mixtures, ethane-propane mixtures); isopentane; and other small quantities of finished products, such as motor gasoline, special naphthas, jet fuel, kerosene, and distillate fuel oil.
Other Liquids: Biodiesel, ethanol, liquids produced from coal and oil shale, non-oil inputs to methyl tertiary butyl ether (MTBE), Orimulsion, and other hydrocarbons.
Refinery Processing Gain: The volumetric amount by which total refinery output is greater than input for a given period of time. This difference is due to the processing of crude oil into products which, in total, have a lower specific gravity than the crude oil processed.
Refinery Processing Loss: The volumetric amount by which total refinery output is less than input for a given period of time. This difference is due to the processing of crude oil into products which, in total, have a higher specific gravity than the crude oil processed.
Appendix 2. Related Web Pages
Appendix 3. Fitting Procedure
I fit the following hyperbolic-tangent function to data that approach an asymptote:
 ,
,
where a = initial steady value, b = final steady value, t0 is the "break" point (i.e., the place where the slope changes from increasing to decreasing) and w is the "width" or time constant when t represents time, as is the case here. The hyperbolic-time constant is twice the exponential time constant near the break point. Usually a = 0.
This function assumes that the data being fitted goes from one steady value, a, through a transition with break point, t0, to a final steady value, b.
Appendix 4. Exponential Time Constant
Since the data used here are yearly data, it is of interest to convert the exponential time constants to % change per year. The equation for the conversion is
The %/year values for different exponential time constants are:
tau (years): |
1 |
2 |
3 |
4 |
5 |
6 |
7 |
8 |
9 |
10 |
%/year |
171.8% |
64.9% |
39.6% |
28.4% |
22.1% |
18.1% |
15.4% |
13.3% |
11.8% |
10.5% |
Go to the top.
References
Afterward
The title of this article was chosen in refutation of the book The Solar Fraud: Why Solar Energy Won't Run the World by Howard C. Hayden.
L. David Roper interdisciplinary studies
L. David Roper, http://www.roperld.com/personal/roperldavid.htm
6 April, 2016