 .
.The sum is due to the fact that the extraction rate may have more than one peak.
L. David Roper
http://www.roperld.com/personal/RoperLDavid.htm
2 July, 2016
The U.S. Energy Information Administration gives data for extraction rates and current estimated reserves for crude-ol extraction in the United States. The 2010 estimated reserves value for crude oil is 23.267 x 10⁹ barrels.
One often reads in the press and/or on the Internet that a certain fossil fuel is sufficiently available to last hundreds of years. That is a meaningless statement because it implies, if not explicitly stated, the assumption that the current rate of extraction will remain the same into the future, which will not be even close to reality.
Any mineral, such as a fossil fuel, follows a depletion curve in its extraction rate in that it rises quickly and then slows down to a peak and they falls rapidly either faster or slower than it rose. That is, the peaked depletion curve may be asymmetric. The area under the depletion curve is the amount that will eventually be extracted, which is the sum of the amount already extracted plus the true extractable reserves. There is an excellent mathematical method to arrive at a depletion curve for any mineral. The basic equation is the Verhulst function:
.
The sum is due to the fact that the extraction rate may have more than one peak.
For each peak ![]() is the amount to be eventually extracted,
is the amount to be eventually extracted, ![]() is the rising exponential time constant in years units, n
is the rising exponential time constant in years units, n![]() is the falling exponential time constant and t1/2 is the time in years units at which the resource is one-half depleted. The parameter n determines the amount of skewing at large times. For n = 1 the extraction curve is symmetrical and the peak occurs at t1/2. The deviation of the peak time from t1/2 is negative for n > 1 (skewed toward large times) and is positive for n < 1 (skewed toward small times).
is the falling exponential time constant and t1/2 is the time in years units at which the resource is one-half depleted. The parameter n determines the amount of skewing at large times. For n = 1 the extraction curve is symmetrical and the peak occurs at t1/2. The deviation of the peak time from t1/2 is negative for n > 1 (skewed toward large times) and is positive for n < 1 (skewed toward small times).
When a peak is symmetrical, the Verhulst function simplifies to
 .
.
Any study of fossil fuel extraction that claims to predict the future of the extraction, to be honest, must present the predicted depletion curve, not some meaningless statement about the future extraction. Then any study that refutes that prediction must show a depletion curve that disagrees with the one being refuted. The area under the refuting depletion curve must be equal to the sum of the amount already extracted plus a defensible estimate of the reserves. The best current estimate of reserves for fossil fuels is given and regularly updated by the Energy Information Agency (EIA) of the United States Department of Energy. If the area under a depletion curve greatly deviates from the EIA value, a rational explanation must be given why.
Four Verhulst functions do an excellent job of fitting the yearly extraction data for crude oil in the United States:
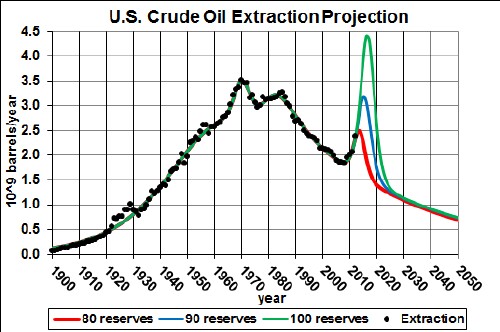
The red curve is for much more than the 2011 EIA reserves estimate (26.5x10⁹ barrels), namely 80x109 barrels. The green curve is for increasing the reserves to 5.90 x10⁹ barrels and the blue curve is for increasing the reserves to 100 x109 barrels.
The recent rise in extraction will probably peak before ~2020 and then decline rapidly.
Obviously, there is no hope for long-term crude-oil independence for the United States.
The last peak is assumed to be symmetric since no data on the decline side are available to determine otherwise.
U.S. crude-oil reserves estimated by the EIA for the last six years are:
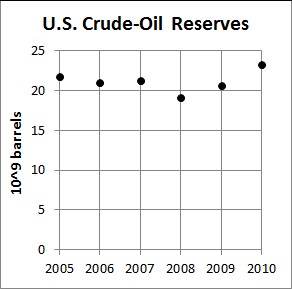
The last three estimates can be fitted with a symmetric Verhulst function to see if a peak can be found:
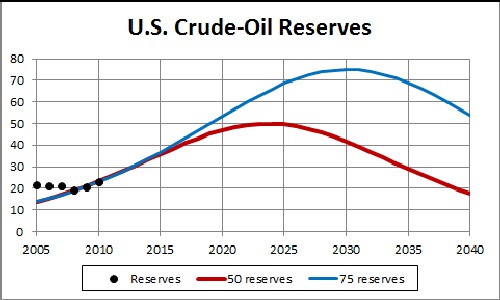
This two fits are made so that the peak values are ~50 x109 barrels and ~75 x109 barrels, which are used to get the depletion curves above.
When a reserves estimate is rising with time, the eventual peak is the value that should be used in fitting the extraction rate. When a reserves estimate is falling with time, the last-available estimate is the value that should be used in fitting the extraction rate.
It is interesting to compare the crude-oil extraction rates for the six main extracting countries:
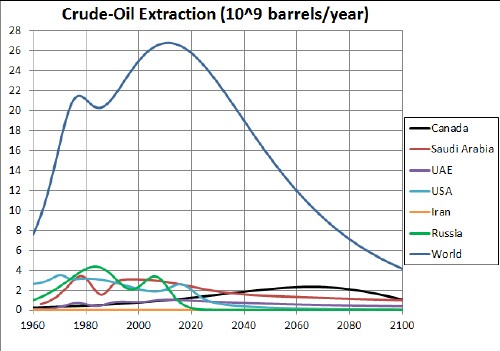
The USA depletion curve is for the high reserves value 50 x109 barrels.
Comparing U.S. extraction to Saudi Arabia extraction:
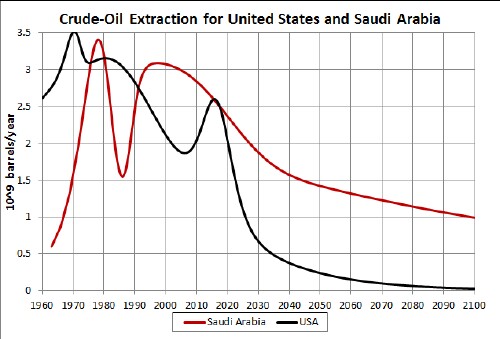
If the U.S. reserve value is 50 x109 barrels, U.S. extraction may exceed Saudi-Arabia extraction for a brief period at ~2015.
The blue curve in the first graph above probably is a maximum representation of the future of crude-oil extraction in the United States. The last peak of the blue curve could be higher but narrower or lower but wider. Thus, it appears that the extraction of crude-oil in the United States will peak before 2025 and then fall rapidly.