L. David Roper
http://www.roperld.com/personal/RoperLDavid.htm
2 July, 2016
In this work I add social costs for fossil fuels to the cost/kWh over time to plot where the real costs of renewable energy has crossover times with the three fossil fuels natural gas, crude oil and coal.
I use the calculation of social costs for fossil fuels given by the study:
The Social Costs of Energy Consumption (book):
|
|
I have done fits of fossil-fuel prices as functions of the amount of them left to extract:
Here I use the "damped" results of the three fossil-fuels fits with an estimate of time dependence of wind-energy and photovoltaic cost with time to plot the prices crossovers. Then I use the estimated social costs of fossil-fuels energy to plot the new prices crossover. I then factor in USA inflation for fossil-fuels prices.
I estimate the time dependence of wind-energy cost from http://www.awea.org/faq/wwt_costs.html . It states that the cost of wind energy was about $0.30/kWh in 1980 and is now, 2010, about $0.05/kWh. I then used an exponential between those two values: P = 0.04 + 0.30 exp[-0.11(t - 1980)].
The Social Costs of Energy Consumption work gives a 1988 estimate of the social cost of fossil fuels as 0.04 - 0.09 DM/kWh. The 1988 onversion factor is $ = 1.76 DM. So, the range is $0.023 - $0.051. I assume that the lower limit ($0.023) is for natural gas, the upper limit ($0.051) is for coal and the middle point ($0.037) is for crude oil.
The energy content of the three fossil fuels are about:
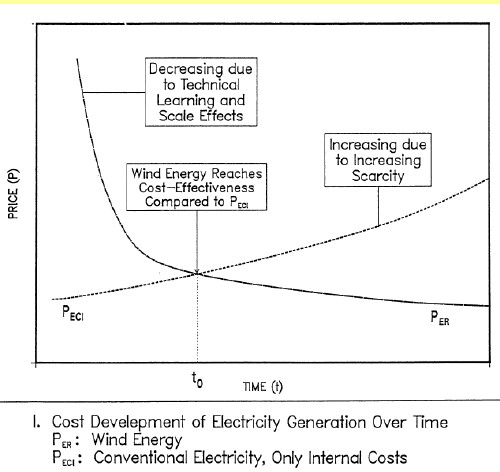
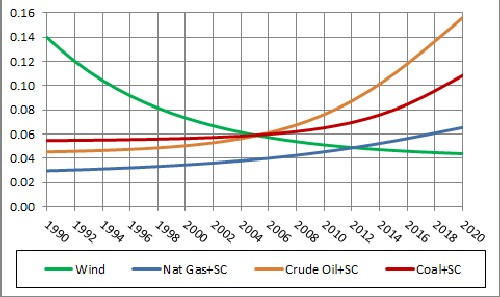
The crossovers without accounting for social costs of fossil fuels are:
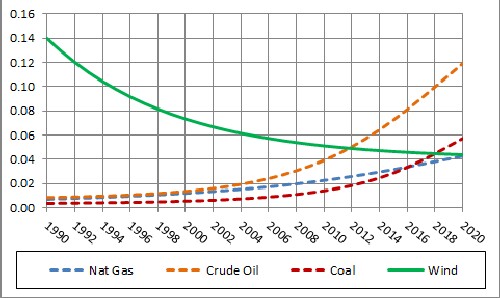
The nearest crossover is between wind and crude oil at about 2012.
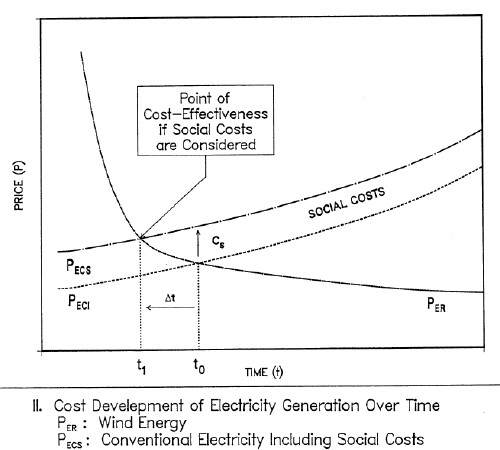
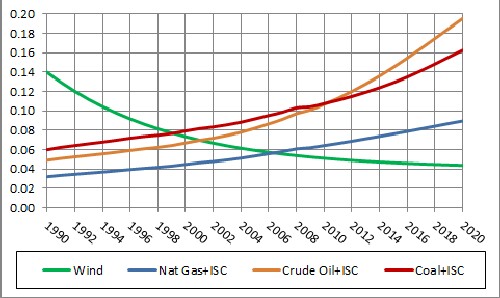
When the social costs for fossil fuels are added, the crossovers are:
It is interesting that wind, crude oil and coal had mutual crossovers at about 2005. Wind and natural-gas crossover is about 2012.
When one includes the inflation rate since 1988 for the social costs the crossovers will occur sooner. The inflation rate is automatically included in the energy prices. The USA inflation rates are:
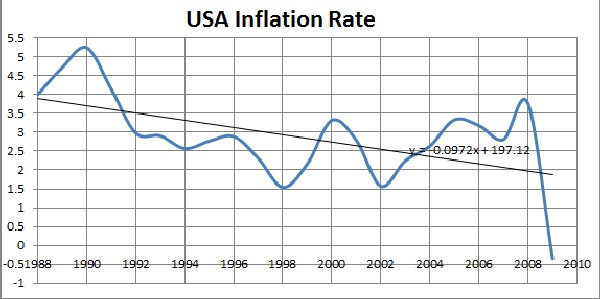
I used the linear-fit equation shown on the graph to calculate predicted inflation rates for years 2010 to 2020. (The average inflation index for the first six months of 2010 was 2.04%; the linear equation yields 1.748% for 2010.)
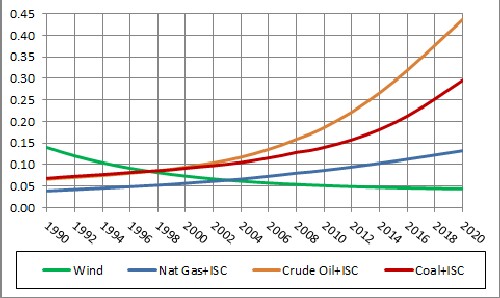
When the inflated social costs for fossil fuels are added, the crossovers are:
The approximate crossover dates are:
These calculations do not allow for the fact that fossil-fuel-extraction social costs, not considering inflation, have increased since 1988. For example, getting crude oil from oil sands, getting natural gas from shale deposits and getting coal by surface mining, including mountain-top removal. If they have increased by 1% per year over the 22 years, the approximate crossover dates are lowered by 1 to 2 years.
I have not allowed for inefficiencies in converting natural gas, crude oil and coal to useable energy in the calculations above.
The global efficiency is ~30% for coal-fired power plants. Perhaps it could be upped to ~50%. I take 40% for this study.
The efficiency of gasoline-combustion engines is ~30% and of diesel-combustion engines is ~45%. Refining crude oil to fuels is ~88% efficient. So, I use ~33% efficiency for crude oil, the average for gasoline and diesel refined from crude oil.
The efficiency of electric power production from natural gas is ~50%.
The kWh given for wind energy is the delivered energy; so the efficiency factor has already been applied.
I included the efficiencies for fossil fuels described above, but did not add in increased social costs, except for inflation, since 1988:
The approximate crossover dates are:
I estimate the time dependence of photovoltaic-energy cost from http://www.window.state.tx.us/specialrpt/energy/renewable/solar.php. It states that the cost of solar-PV energy was about $0.45/kWh in 1990 and is now, 2010, about $0.23/kWh. Several companies (e.g., http://www.solarbuzz.com/StatsCosts.htm) claim that the cost will soon be brought down to 5 to 10 cents/kWh. I devised an exponential decline that approximately matches the 1990 and 2020 costs: P = 0.04 5+ 0.4 exp[-0.065(t - 1990)].
I included the efficiencies for fossil fuels described above, but did not add in increased social costs, except for inflation, since 1988:
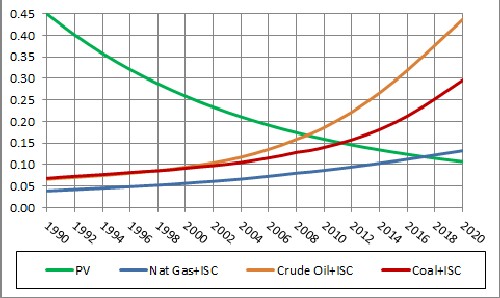
The approximate crossover dates are:
![]()
According to this study, solar and nulear energy have a crossover at about 2010.