 .
.The sum is due to the fact that the extraction rate may have more than one peak.
L. David Roper
http://arts.bev.net/RoperLDavid/
11 June, 2016
The U.S. Energy Information Administration gives data for extraction rates and current estimated reserves for natural-gas extraction in the United States. The 2010 estimated reserves value for all types of natural gas is 940 x 1012 ft3.
One often reads in the press and/or on the Internet that a certain fossil fuel is sufficiently available to last hundreds of years. That is a meaningless statement because it implies, if not explicitly stated, the assumption that the current rate of extraction will remain the same into the future, which will not be even close to reality.
Any mineral, such as a fossil fuel, follows a depletion curve in its extraction rate in that it rises quickly and then slows down to a peak and they falls rapidly either faster or slower than it rose. That is, the peaked depletion curve may be asymmetric. The area under the depletion curve is the amount that will eventually be extracted, which is the sum of the amount already extracted plus the true extractable reserves. There is an excellent mathematical method to arrive at a depletion curve for any mineral. The basic equation is the Verhulst function:
.
The sum is due to the fact that the extraction rate may have more than one peak.
For each peak ![]() is the amount to be eventually extracted,
is the amount to be eventually extracted, ![]() is the rising exponential time constant in years units, n
is the rising exponential time constant in years units, n![]() is the falling exponential time constant and t1/2 is the time in years units at which the resource is one-half depleted. The parameter n determines the amount of skewing at large times. For n = 1 the extraction curve is symmetrical and the peak occurs at t1/2. The deviation of the peak time from t1/2 is negative for n > 1 (skewed toward large times) and is positive for n < 1 (skewed toward small times).
is the falling exponential time constant and t1/2 is the time in years units at which the resource is one-half depleted. The parameter n determines the amount of skewing at large times. For n = 1 the extraction curve is symmetrical and the peak occurs at t1/2. The deviation of the peak time from t1/2 is negative for n > 1 (skewed toward large times) and is positive for n < 1 (skewed toward small times).
When a peak is symmetrical, the Verhulst function simplifies to
 .
.
Any study of fossil fuel extraction that claims to predict the future of the extraction, to be honest, must present the predicted depletion curve, not some meaningless statement about the future extraction. Then any study that refutes that prediction must show a depletion curve that disagrees with the one being refuted. The area under the refuting depletion curve must be equal to the sum of the amount already extracted plus a defensible estimate of the reserves. The best current estimate of reserves for fossil fuels is given and regularly updated by the Energy Information Agency (EIA) of the United States Department of Energy. If the area under a depletion curve greatly deviates from the EIA value, a rational explanation must be given why.
Three Verhulst functions do an excellent job of fitting the yearly extraction data for natural gas in the United States:
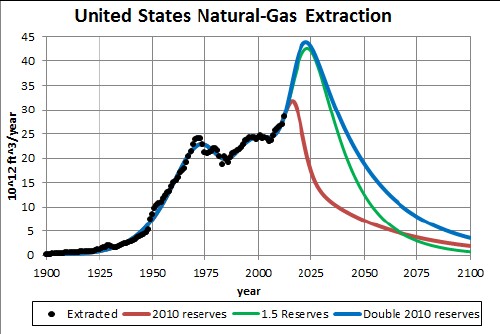
The red fit using three Verhulst functions is for the 2010 estimated reserves value of 940 x 1012 ft3. The last peak of the red curve, which is essentially natural gas from shale deposits, could be higher but narrower or slightly lower but wider.
The green fit is for a 2010 reserves value 1.5 times larger than the EIA estimated value; i.e., 1410 x 1012 ft3. The last peak of the green curve could be higher but narrower or lower but wider.
The blue fit is for a 2010 reserves value twice as large as the EIA estimated value; i.e., 1880 x 1012 ft3. The last peak of the blue curve could be higher but narrower or lower but wider.
The two highest green and blue curves in the graph above were based on simply increasing the EIA's 2010 estimate of reserves by factors of 1.5 and 2, respectively. One expects reserves estimates to change with time. When new discoveries, such as shale gas, occur the reserves will climb to a peak and then eventually fall to zero as depletion occurs. The following graph shows the EIA reserves estimates versus year and a Verhulst fit to the values assuming that the eventual decline will have the same fall rate as the rise rate:
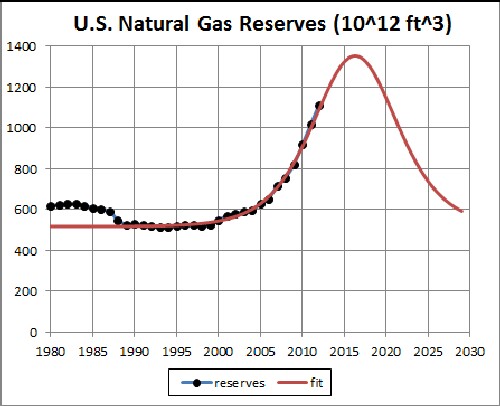
The fit is done only to reserves values from 1990 to 2010.
When a reserves estimate is rising with time, the eventual peak is the value that should be used in fitting the extraction rate. When a reserves estimate is falling with time, the last-available estimate is the value that should be used in fitting the extraction rate. Note that the reserves peak of 1357 x 1012 ft3.is slightly lower than the 1410 x 1012 ft3 reserves value used to calculate the green curve in the first graph, so the green curve is probably a good estimate of future extraction rates.
For natural gas to be traded globally it must be converted from a gas to a liquid under pressure called LNG.
The following graph shows global LNG prices ($/106 ft^3 gas) in June 2015:
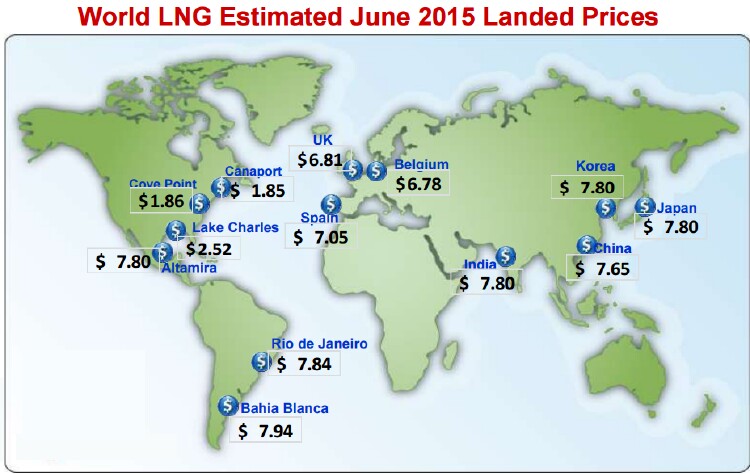
Note that LNG prices are much lower in the USA than in other countries; so, USA natural-gas-extracting companies want to export as much gas as possible.
It appears that the green curve in the first graph above is a reasonable representation of the future of natural-gas extraction in the United States. The last peak of the green curve could be higher but narrower or lower but wider. Thus, it appears that the extraction of natural gas in the United States will peak before 2025 and then fall rapidly.