Oil: Not Exactly Dead Dinosaurs
Excel spreadsheet listing some of the data used for the following analyses
Other related web pages:
Contents:
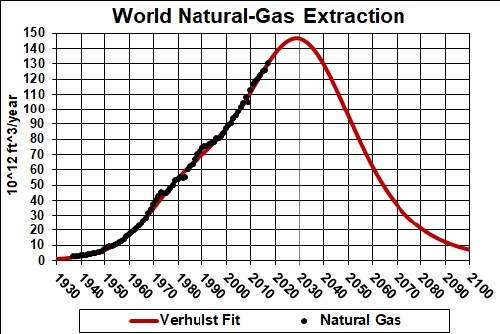
Using the Depletion Theory that I have previously developed, I show here fits to United States and World extraction of crude oil, natural gas and coal. The depletion equation used to fit the extraction data is the Verhulst function:
The Q parameter is the total amount eventually to be extracted. The n parameter is a measure of the asymmetry: symmetric is n=1, skewed to early times is n<1 and skewed to later times is n>1.
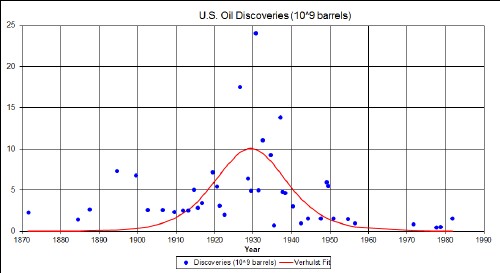
United States Crude-Oil ExtractionCurrent Crude-Oil-Futures Price U.S. crude-oil discoveries ( http://www.durangobill.com/Rollover.html) and a Verhulst-function fit to the data. |
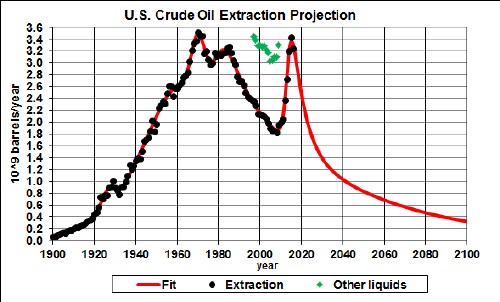
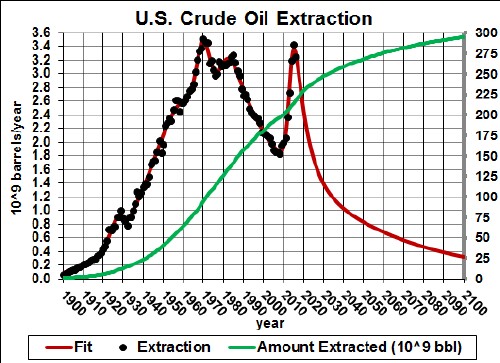
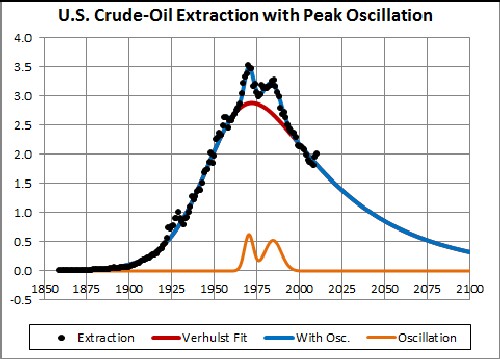
Fit of the Verhulst function to U.S. crude oil extraction. Note that the peak occurred 1975-8. This is the best example of crude-oil depletion.: The total amount to be extracted is 312 x 109 barrels. |
When natural resources peak they usually oscillate around the peak. U.S. Crude-Oil Extraction with sinx/x oscillations on both sides of the peak: The oscillation is mathematically represented by two sinx/x functions, one before the peak and one after the peak; they are added to the Verhulst function. An equally good fit can be obtained by using two Gaussian functions instead of sinx/x functions. My reasoning for the oscillation is that, when starting to peak, great effort is made to keep the extraction increasing; after that fails and extraction starts to fall, great effort again is made to keep it from falling. Eventually that final great effort also fails. |
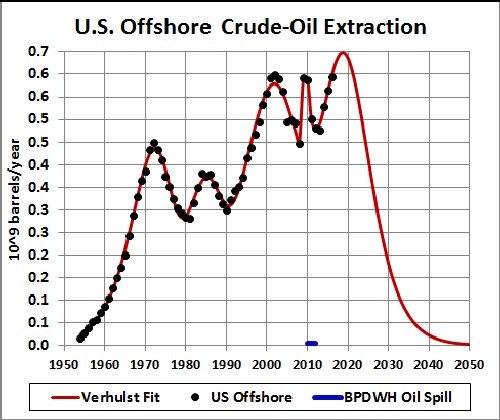
Fit of the Verhulst function to U.S. crude oil offshore extraction and projection to year 2050: The amount left to be extracted is optimistically assumed to be 7.55 x 10⁹ barrels, larger than the proved reserves of 4.335 x 10⁹ barrels. The Deepwater Horizon oil spill caused a drastic reduction in offshore extraction after 2010. |
Comparison of U.S. offshore crude-oil extraction to Alaska and total U.S, extraction: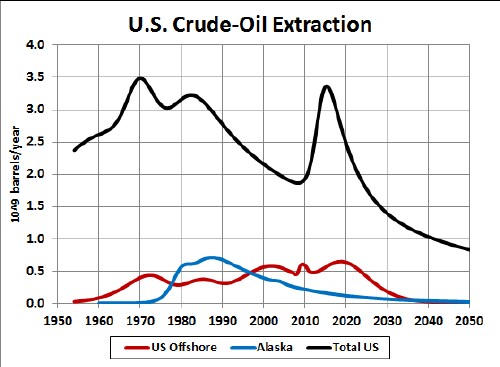 |
Best fit to U.S. offshore crude-oil extraction of the total extraction: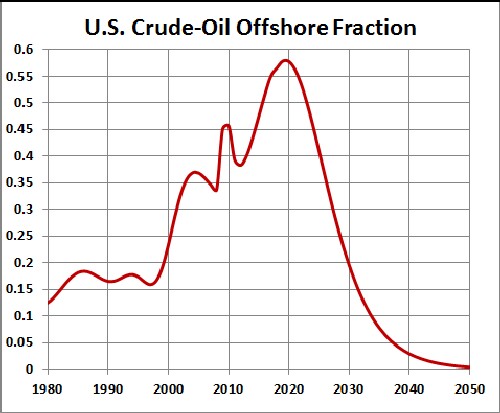 |
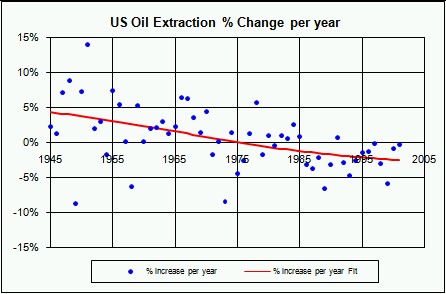
This shows the change in U.S. crude oil extraction since 1945. The biggest recent yearly decrease was -6.7% in 1989 during the BushGHW administration. The average yearly decrease was -3.1% for the BushGHW administration and -2.7% during the Clinton administration. Note that the yearly changes oscillate depending on many factors, but the general trend is downward. No administration should be blamed for most of these factors and no administration can change the fact that the U.S. is running out of economically feasible crude oil.
|
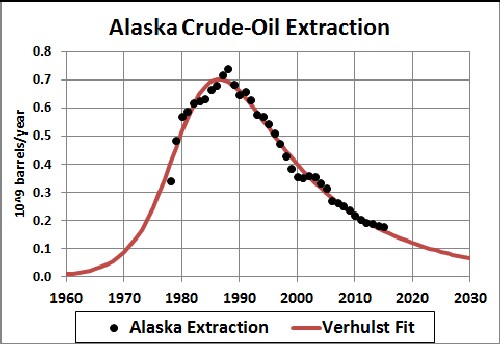
Data are from: http://www.eia.gov/dnav/pet/hist/LeafHandler.ashx?n=PET&s=MCRFPAK1&f=M http://www.tax.alaska.gov/programs/documentviewer/viewer.aspx?426 The extraction peak occurred in less than 2 decades after the big Prudhoe Bay discovery. |
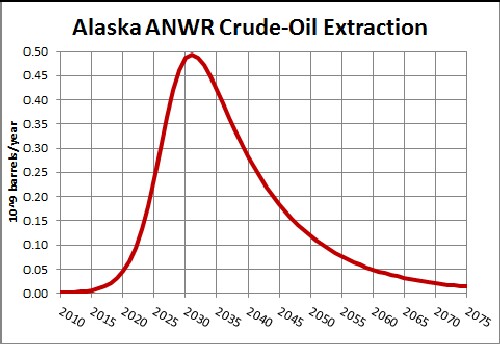
Possible Alaska ANWAR crude-oil extraction: A high-value assumption has been made that the eventual total extraction will be 1010 barrels. Further assumptions are that the initial speed of extraction will be ~30% less than the Prudhoe-Bay speed and that the asymmetry will be the same as for Prudhoe-Bay extraction. |
|
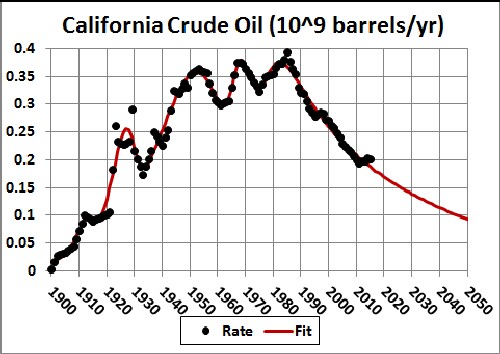
This is included because of claims that there will be future increases in crude-oil extraction in California. The sum (31.9 x 10⁹ barrels) of the 2014 EIA estimate of reserves (~2.854 x 10⁹ barrels) and the amount already extracted (~29.0 x 10⁹ barrels) is smaller than the area under the curve (38.4 x 10⁹ barrels). Thus, if the EIA reserves estimate is correct, there is no major future for crude-oil extraction in California. |
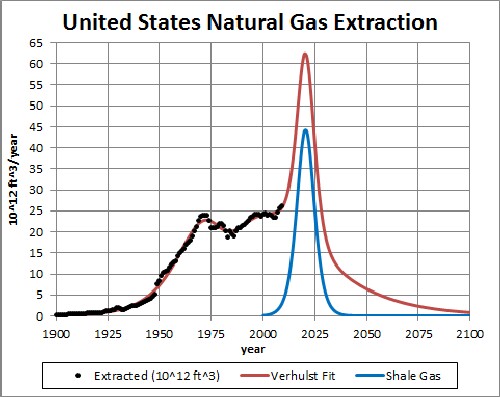
United States Natural-Gas ExtractionCurrent Natural-Gas-Futures Price Fit of the Verhulst function to U.S. natural gas extraction. The short large blip is shale gas. So, shale natural gas adds a short large blip to the natural-gas extraction for the United States. It could be reduced in size and stretched out over a larger time interval, but I doubt it will be. The U.S. will probably extract and use it as fast as possible. See http://www.roperld.com/science/minerals/NaturalGasUS.htm . |
The jump just before 1950 is because the previous data did not include wet natural gas. |
 This is for reserves much larger than the 2014 reserves of 15.28 x 10^12 ft^3. |
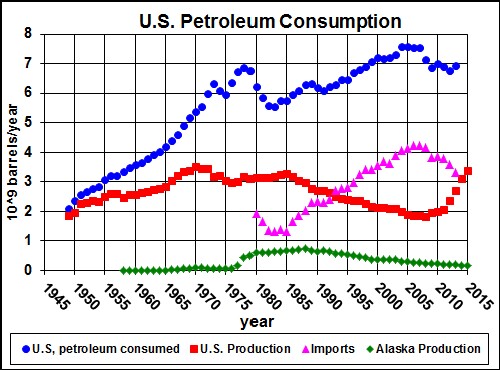
United States Petroleum ConsumptionThese data came from http://www.eia.doe.gov/pub/oil_gas/petroleum/data_publications/petroleum_supply_monthly/current/txt/table_s02_a.txt. U.S. petroleum consumption since 1949. Note the sharp downward turn during the Carter administration (1977-1980); but then the increases started again by the end of Reagan's first term (1981-1988). Then consumption leveled off during the Bush administration (1989-1992) and then continued the upward trend during the Clinton administration (1993-2000). Note how the onset of Alaska extraction caused a temporary rise in U.S. extraction; but then, after a decade, began to decline. The Arctic National Wildlife Refuge is estimated to contain 7 x 10⁹ bbl of oil. This is about one year's consumption, but it will probably be extracted over a decade or longer, which will be a negligible blip on these curves. |
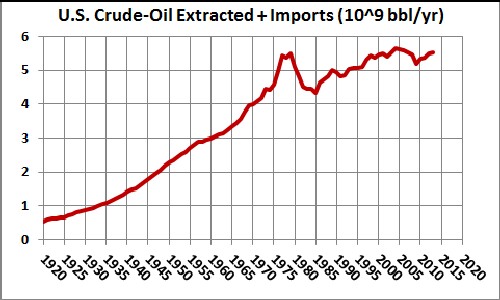
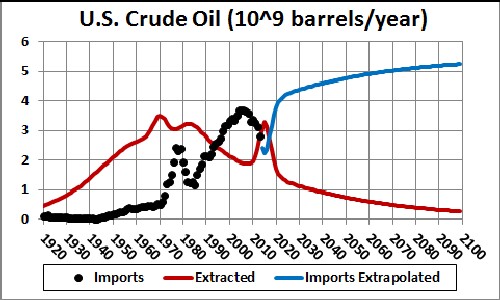
United States Crude-Oil Imports
|
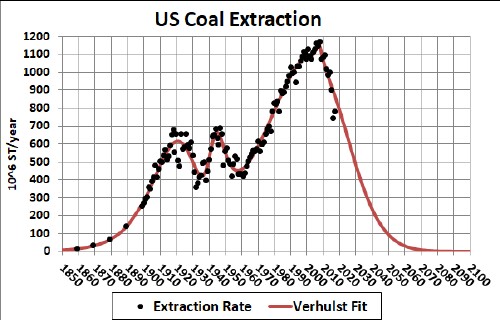
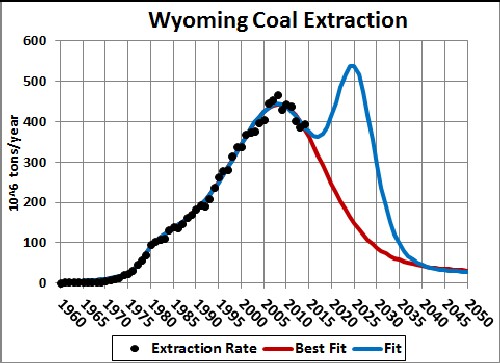
United States Coal Extraction |
||||||||||||||||||||||||||||||||||||||||
Here is a fit with three Verhulst functions:
It appears that "peak coal" has arrived for the United States. |
||||||||||||||||||||||||||||||||||||||||
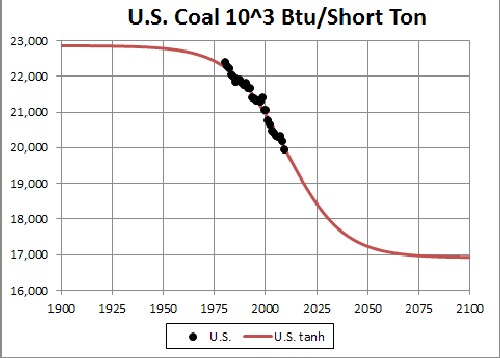
U.S. Coal energy/volume and a hyperbolic-tangent function fit to the data:
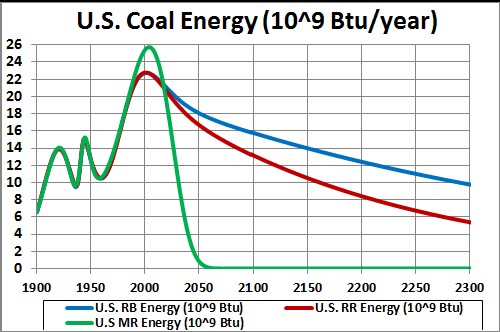
As seen below the final asymptote is somewhat above the energy content of lignite (14 MBtu/ST), as it should be. The initial asymptote is equivalent to mostly bituminous (20.5 MBtu/St), as it should be. Putting the last two graphs together, the energy available from coal in the U.S. is
Although U. S. coal extraction peaks at ~2004-2012, U.S. coal energy peaks at ~2000-2004. |
||||||||||||||||||||||||||||||||||||||||
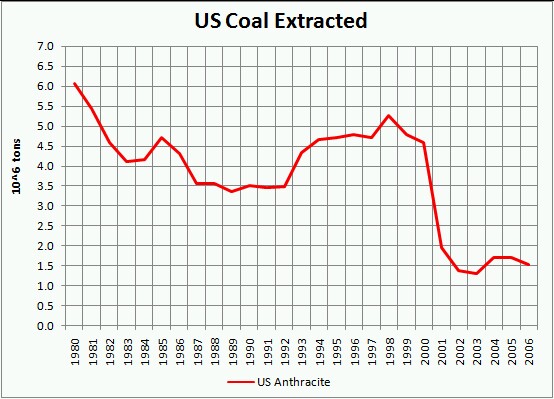
The energy contents of the three different classes of coal are (1 MBtu/ST = 0.8598 MJ/kg):
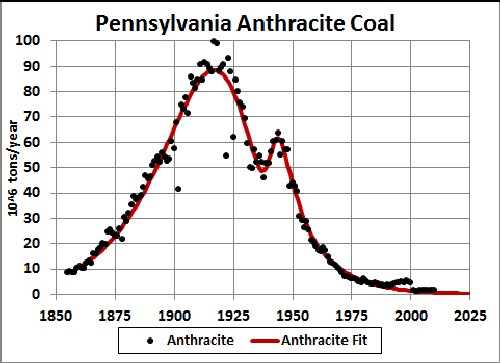
Most of the coal mined in the U.S. is bituminous, with a little lignite. Anthracite extraction is almost negligible:
|
||||||||||||||||||||||||||||||||||||||||
1 Btu = 1055.056 joules = 2.930711x10⁻⁴ kWh |
||||||||||||||||||||||||||||||||||||||||
Here are relevant data for coal extraction in millions of tons per year for the United States:
The list is for the United States and seven states that have had peaks of more than 50-million tons per year and Virginia. |
||||||||||||||||||||||||||||||||||||||||
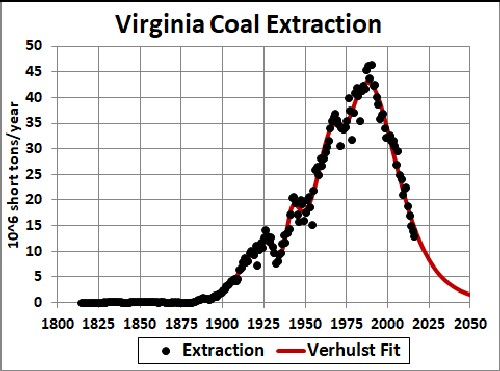
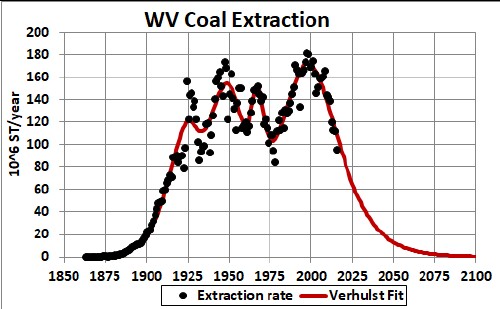
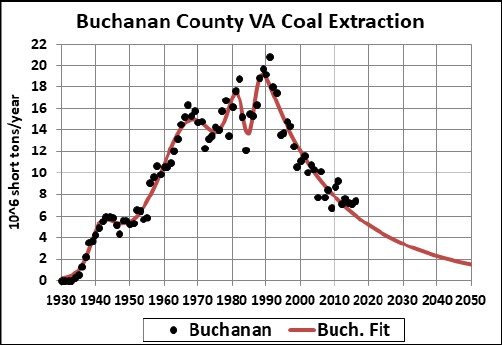
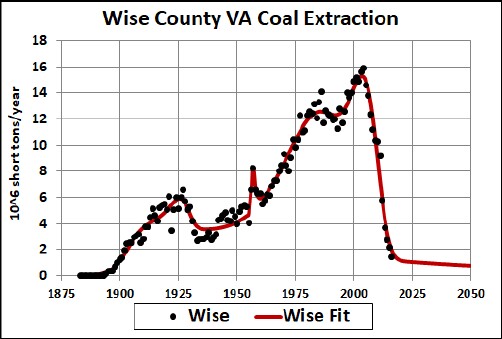
Virginia and West Virginia Coal Extraction
|
||||||||||||||||||||||||||||||||||||||||
Pennsylvania Coal Extraction
|
||||||||||||||||||||||||||||||||||||||||
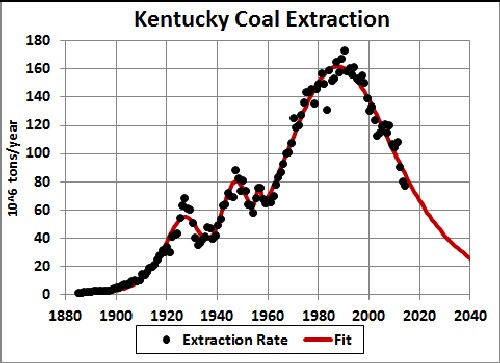
Kentucky Coal Extraction
|
||||||||||||||||||||||||||||||||||||||||
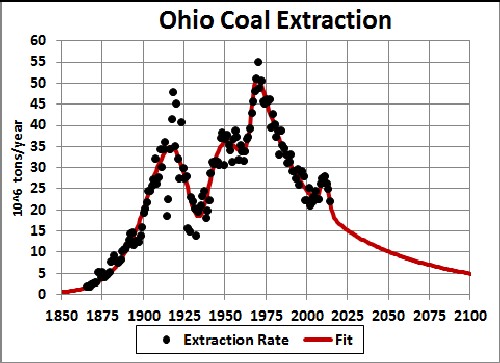
Ohio Coal Extraction
|
||||||||||||||||||||||||||||||||||||||||
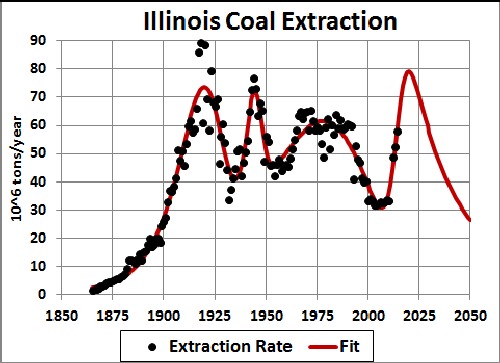
Illinois Coal Extraction
|
||||||||||||||||||||||||||||||||||||||||
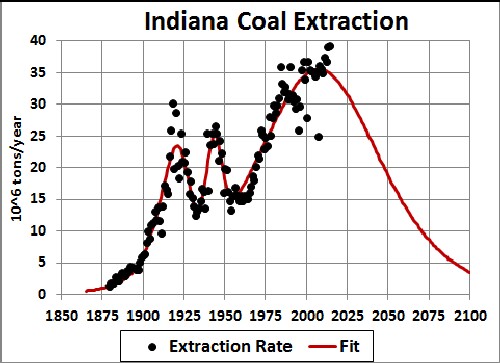
Indiana Coal Extraction
|
||||||||||||||||||||||||||||||||||||||||
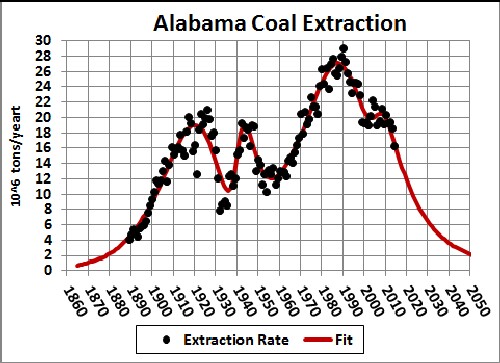
Alabama Coal Extraction
|
||||||||||||||||||||||||||||||||||||||||
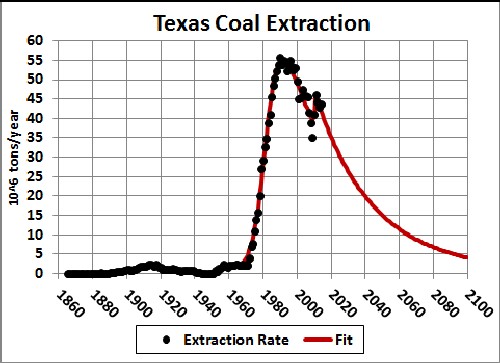
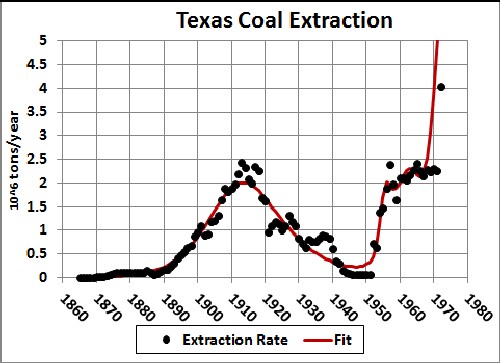
Texas Coal Extraction
|
||||||||||||||||||||||||||||||||||||||||
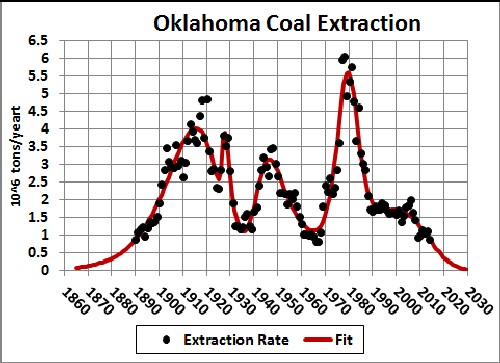
Oklahoma Coal Extraction
|
||||||||||||||||||||||||||||||||||||||||
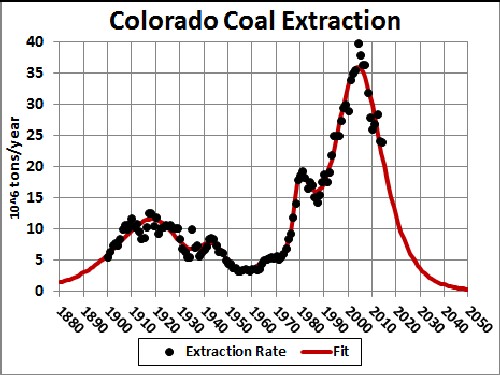
Colorado Coal Extraction
|
||||||||||||||||||||||||||||||||||||||||
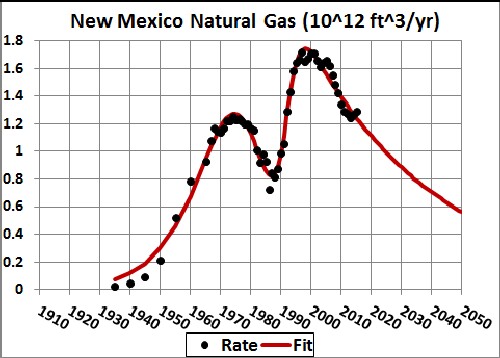
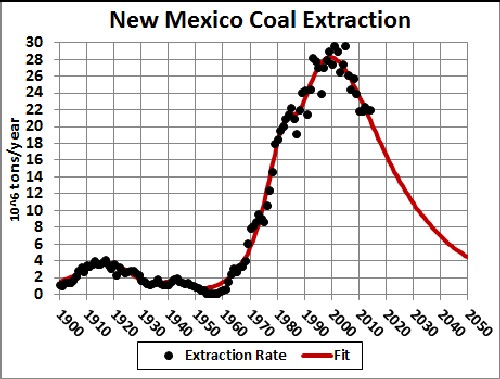
New Mexico Coal Extraction
|
||||||||||||||||||||||||||||||||||||||||
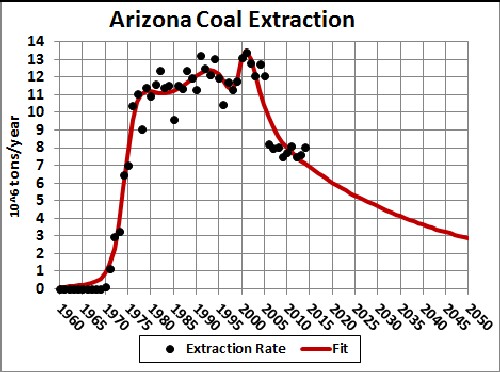
Arizona Coal Extraction
|
||||||||||||||||||||||||||||||||||||||||
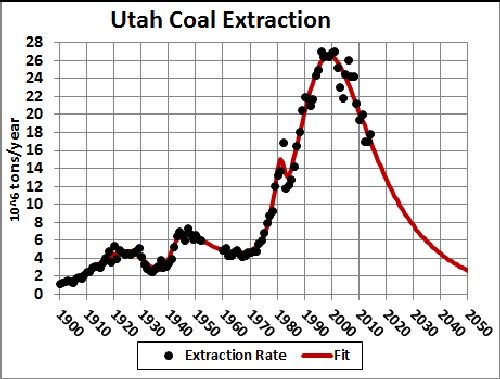
Utah Coal Extraction
|
||||||||||||||||||||||||||||||||||||||||
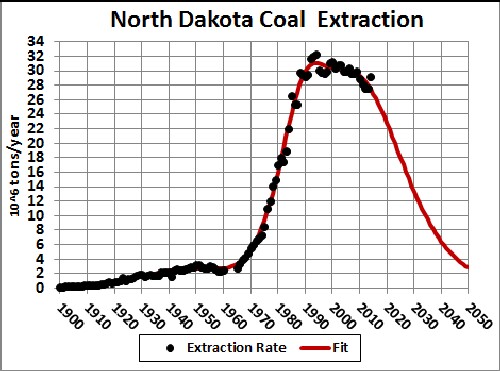
North Dakota Coal Extraction
|
||||||||||||||||||||||||||||||||||||||||
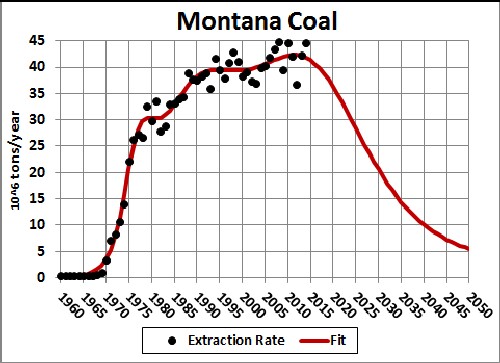
Montana Coal Extraction
|
||||||||||||||||||||||||||||||||||||||||
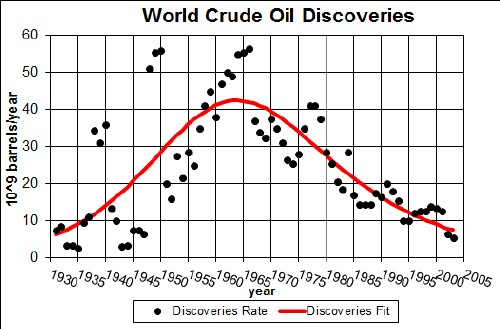
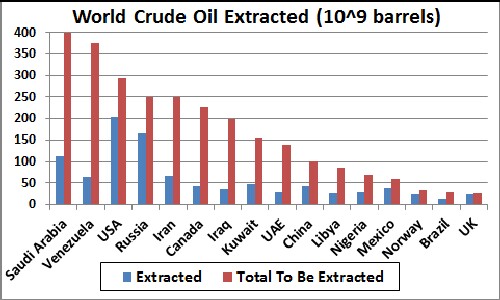
World Crude-Oil ExtractionWorld crude-oil discoveries ( http://www.durangobill.com/Rollover.html) and a Verhulst-function fit to the data.
|
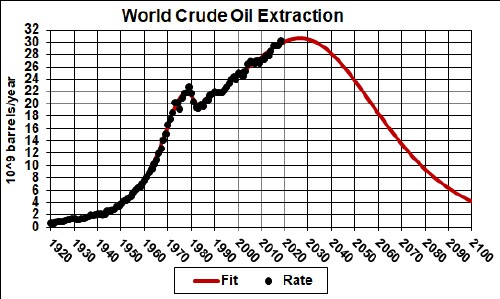
World crude-oil extraction rate and a Verhulst-functions fit to the data obtained by restricting the amount to be extracted in accord with the 2013 estimated reserves value of ~1.656 x 10¹² (trillion) barrels.
|
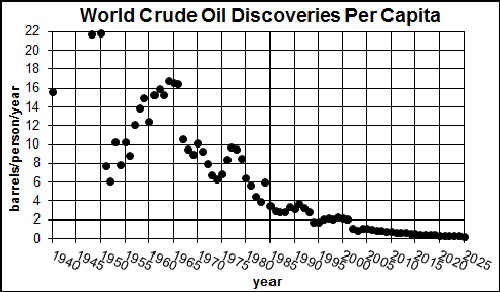
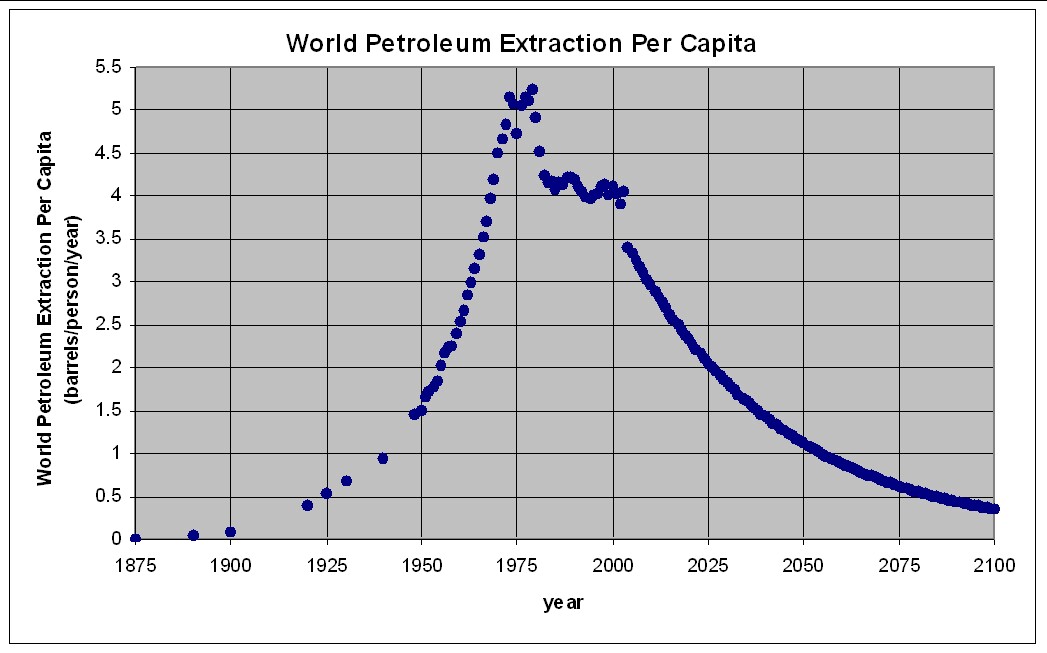
World crude-oil extraction per capita. The extrapolation into the future is obtain by using a fit to World population extrapolated into the future (http://arts.bev.net/roperldavid/WorldPop.htm).
|
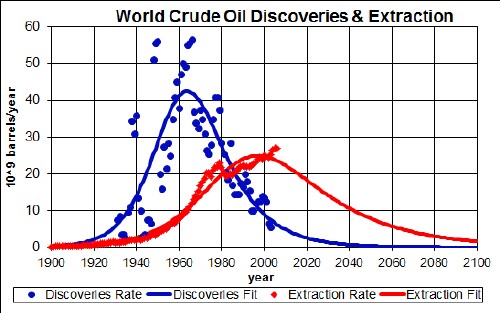
Comparison of world oil discoveries and extraction. This graph contains information that probably will have the greatest effect on those now living and born in the future. Crude Oil cannot be extracted if it has not been discovered! This graph shows very clearly why it is very unlikely that the final amount to be extracted will exceed 2x10¹² barrels. So far the amount extracted has exceeded 1x10¹² barrels, so we are more than halfway there! |
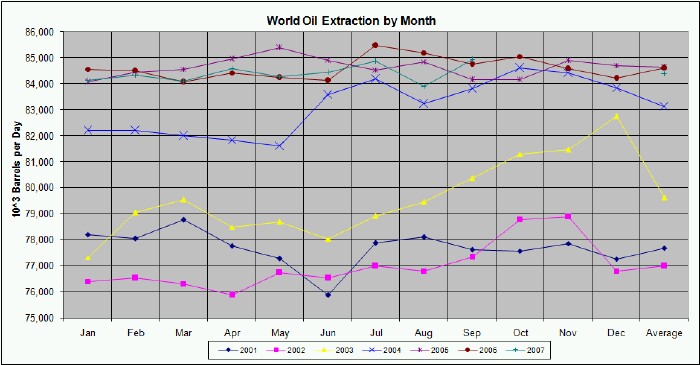
Monthly world oil extraction. |
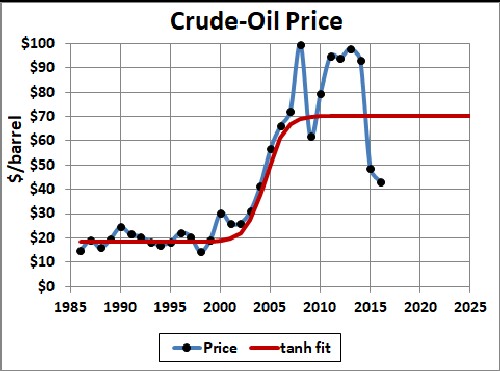
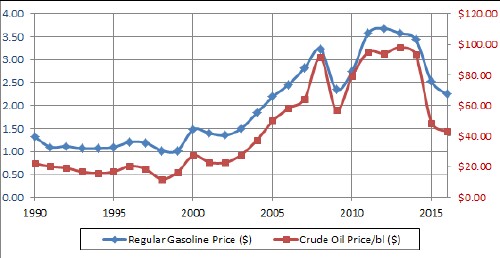
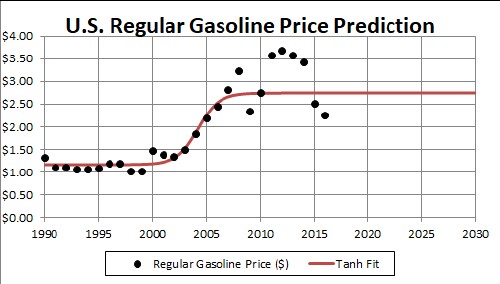
World crude-oil pricesCurrent Crude-Oil-Futures Price It appears that the average annual crude-oil price may be leveling off just below ($100/barrel): Gasoline Prices in the United StatesThis result can be used to predict the future price of gasoline in the United States for 1 January; it should be approximately linear in the price per barrel of crude oil. Here are those two prices:
A hyperbolic-tangent fit of the U.S. regular gasoline price yields:
Correlations of Energy-Minerals Prices and Consumer Energy Prices |
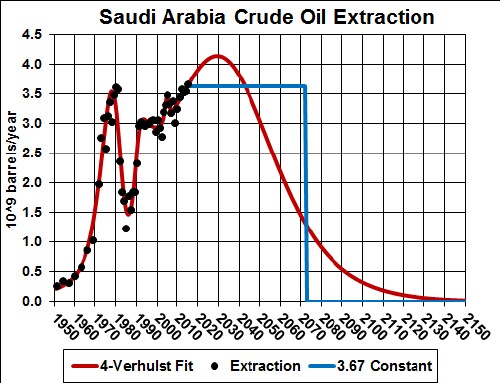
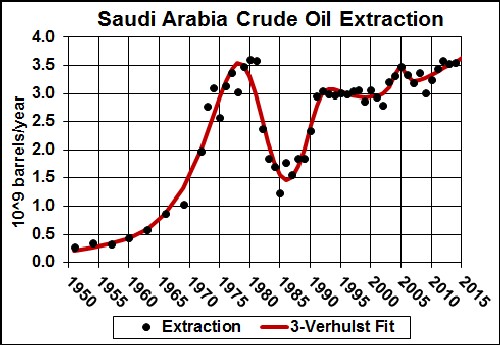
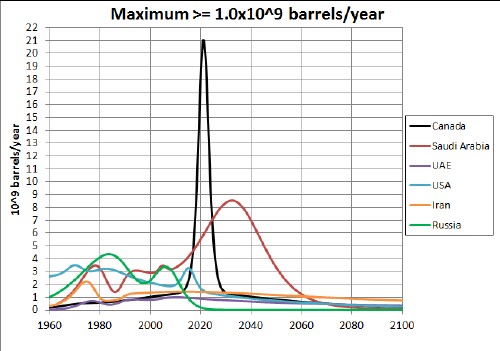
Saudi Arabia crude-oil extractionThis is a four-Verhulst fit to the Saudi Arabia crude-oil extraction data with the set value of Q=350x109 barrels, which is larger than the reported reserves (~268x109 barrels) plus the amount already extracted (~56.5x10⁹ barrels) in 2014. The fit is made with the assumption that the current rise will continue until the peak at ~2020 year and that the last peak will be symmetrical.
The blue curve would be the case if crude-oil extraction were fixed at 3.63x10⁹ barrels per year until the 208x109 barrels of current reserves ran out at about year 2072. The actual case will probably be some curve in between the red and blue curve, with perhaps more than one peak in the future. It is easy to see why Saudi Arabia is installing renewable energy at a rapid pace. |
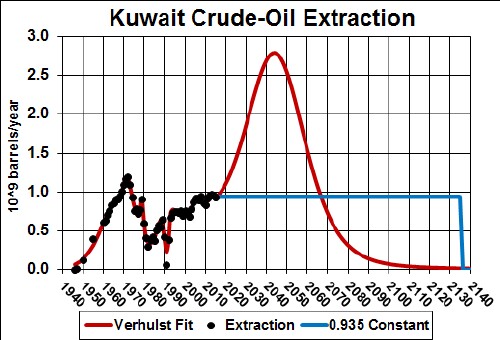
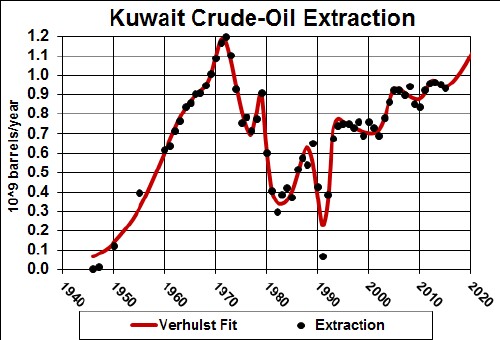
Kuwait crude-oil extractionThis is a two-Verhulst fit to the Kuwait crude-oil extraction data. The total amount to be extracted was set at 155x109 barrels, which is slightly larger than the 2014 reported reserves (~104x109 barrels) plus the amount already extracted (about ~46.7x10⁹ barrels). The last peak is assumed to be symmetrical.
The blue curve would be the case if crude-oil extraction were fixed at 0.935x10⁹ barrels per year until the 104x109 barrels of current reserves ran out at about year 2134. |
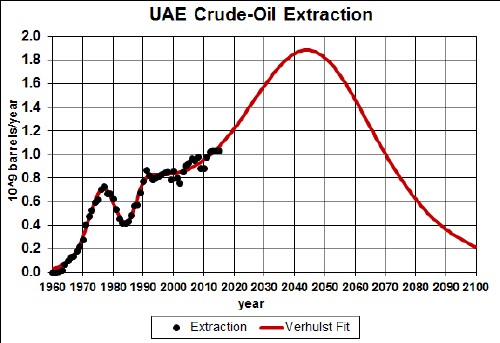
United Arab Emirates crude-oil extractionThis is a 3-Verhulst fit to the UAE crude-oil extraction data. The total amount to be extracted was set at Q=140x109 barrels, which is larger than the 2014 reported reserves (~97.8x10⁹ barrels) plus the amount already extracted (~33.5x10⁹ barrels). The final peak is assumed to be symmetrical.
The blue curve would be the case if crude-oil extraction were fixed at 1.0x10⁹ barrels per year until the 98x109 barrels of current reserves ran out at about year 2130. Seven emirates comprise UAE: Abu Dhabi, Ajman, Dubai, Fujairah, Ras al-Khaimah, Sharjah, and Umm al-Quwain. |
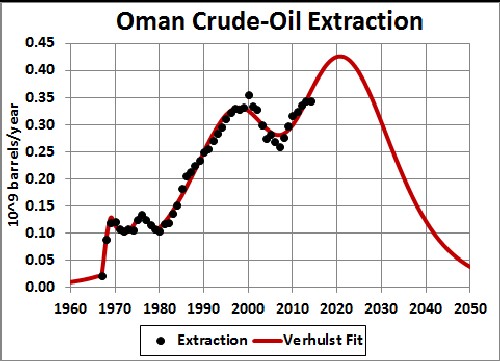
Oman crude-oil extractionThe total amount to be extracted was set at 20x109 barrels for a 3-Verhulst fit, which is larger than the 2014 reported reserves amount (~5.5x10⁹ barrels) plus the amount already extracted (~10.7x10⁹ barrels barrels). The final peak is assumed to be symmetrical.
|
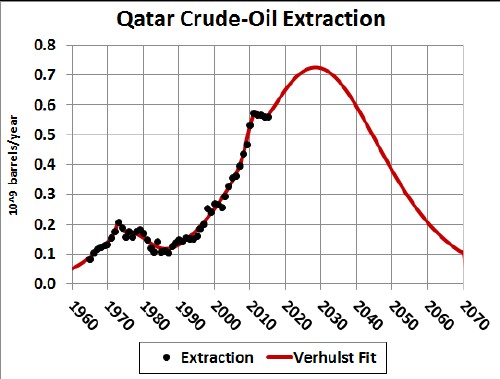
Qatar crude-oil extractionThe total amount to be extracted was set at 40x109 barrels for a Verhulst fit which is slightly larger than the 2014 reported reserves amount (~25x109 barrels) plus the amount already extracted (~12.6x10⁹ barrels barrels).The final peak is assumed to be symmetrical.
|
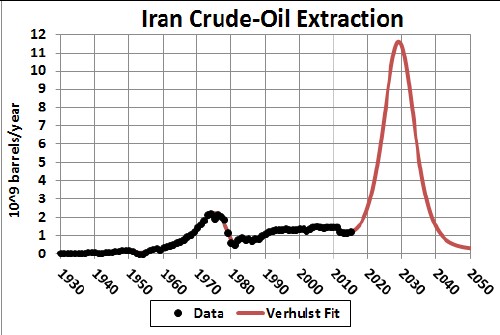
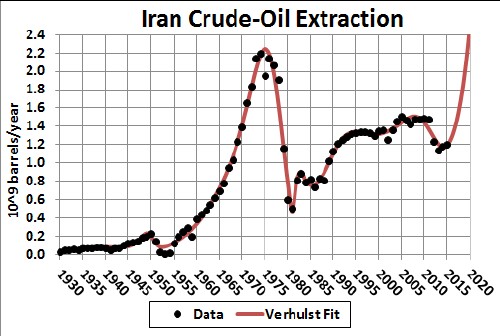
Iran crude-oil extractionThe total amount to be extracted is set at 230x109 barrels, which is about the same as the 2014 reported reserves (~157x109 barrels) plus the amount already extracted (~68x109 barrels).
The 2013 low was due to economic sanctions on Iran. |
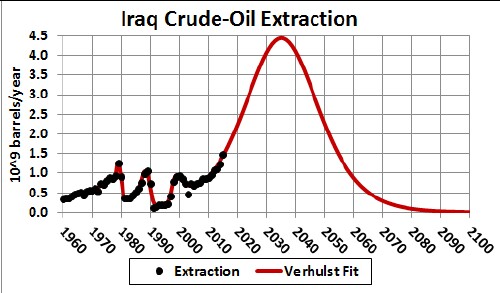
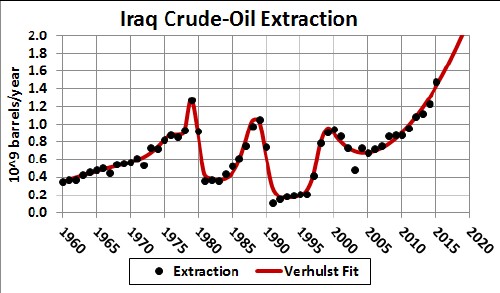
Iraq crude-oil extractionThe 4-Verhulsts fit has a total amount to be extracted set to Q=180x109 barrels, which is slightly more than the 2014 estimated reserves (~140x109 barrels) plus the amount already extracted (~36.7x10⁹ barrels). The final peak is assumed to be symmetrical.
Due to the animosity among three ethnic groups in Iraq, it is likely that its future crude-oil extraction will oscillate around its depletion curve. |
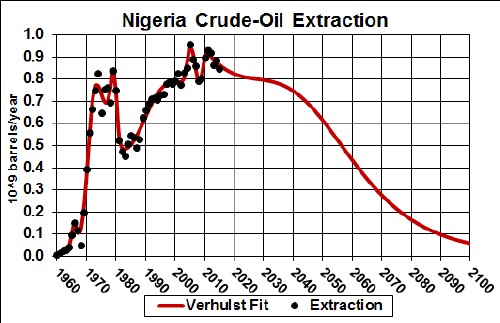
Nigeria crude-oil extractionThe total amount to be extracted was set at 70x109 barrels for a 2-Verhulst fit, which is about the same as the 2014 reported reserves amount (37x109 barrels) plus the amount already extracted (~33x109 barrels). The final peak was assumed to be symmetrical.
|
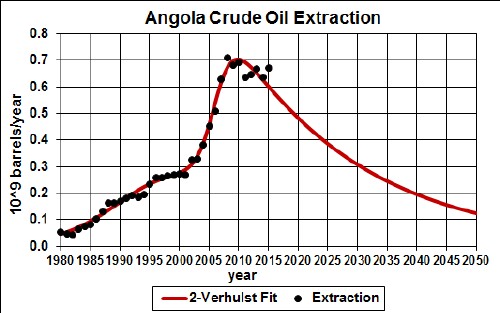
Angola crude-oil extractionThe total amount to be extracted was set at 25x109 barrels for a 2-Verhulst fit, which is slightly less than the 2014 reported reserves amount (9.1x10⁹ barrels) plus the amount already extracted (~11.6x10⁹ barrels).
|
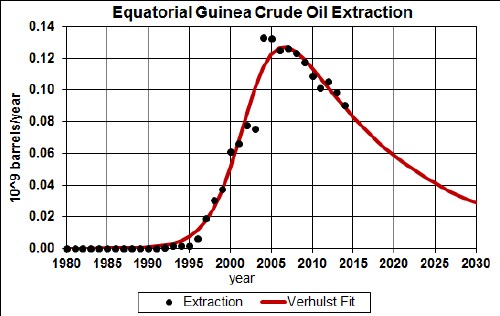
Equatorial Guinea crude-oil extractionThe total amount to be extracted searched to 2.87x10⁹ barrels for a Verhulst fit which is smaller than the 2014 reported reserves amount (~1.1x10⁹ barrels) plus the amount already extracted (~2.74x10⁹ barrels).
The years before 1995 were not used in making the fit. |
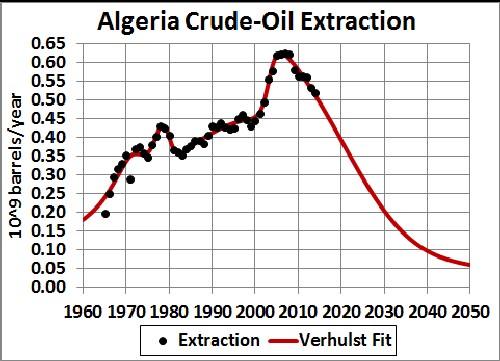
Algeria crude-oil extractionThe total amount to be extracted searched to 36.3x10⁹ barrels for the Verhulst fit, which is slightly smaller than the 2014 reported reserves amount (~12.2x10⁹ barrels) plus the amount already extracted (~26.5x10⁹ barrels).
|
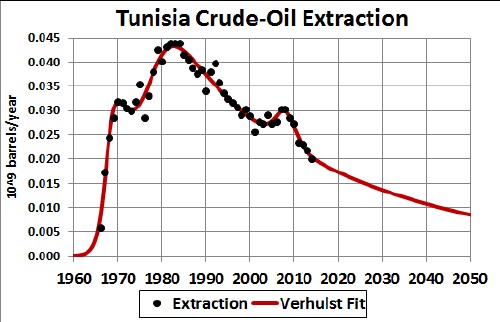
/Tunisia crude-oil extractionThe total amount to be extracted searched to 2.16x10⁹ barrels for the Verhulst fit which is slightly larger than the 2014 reported reserves amount (~0.425x10⁹ barrels) plus the amount already extracted (~1.55x10⁹ barrels).
|
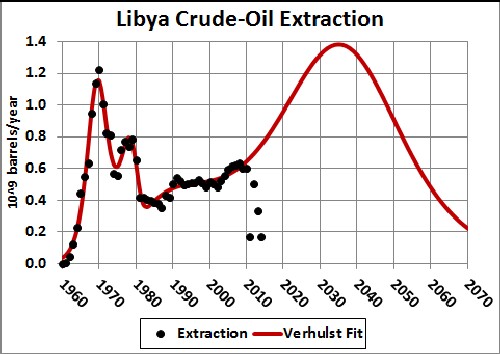
Libya crude-oil extractionThe total amount to be extracted was set at 85x109 barrels for the Verhulst fit which is slightly larger than the 2014 reported reserves amount (~48.5x10⁹ barrels) plus the amount already extracted (~30.3x10⁹ barrels). The final peak is assumed to be symmetrical.
The last few years, whose low values were due to the civil war, were not used in making the fit. |
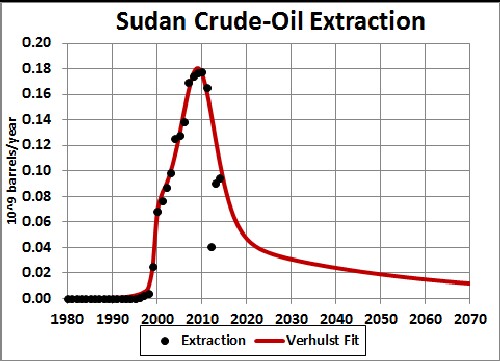
Sudan crude-oil extractionThe total amount to be extracted was set at 4x10⁹ barrels for the Verhulst fit, which is about the same as the 2013 reported reserves amount (~1.25x10⁹ barrels) plus the amount already extracted (~1.84x10⁹ barrels).
Years before 2000 and the last 4 years were not used in making the fit. |
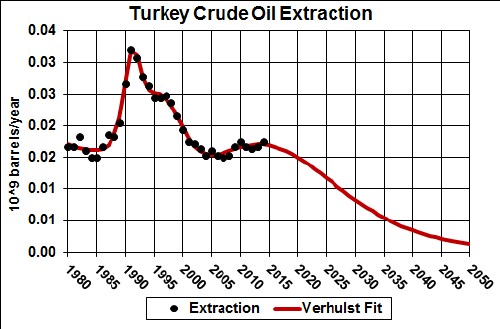
Turkey crude-oil extractionThe total amount to be extracted was set to 1.5x10⁹ barrels for the Verhulst fit which is about the same as the 2014 reported reserves amount (~0.2948x10⁹ barrels) plus the amount already extracted (~1.196x10⁹ barrels). The final peak was assumed to be symmetrical.
|
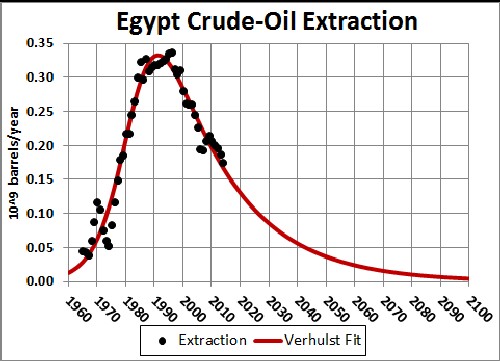
Egypt crude-oil extractionThe total amount to be extracted searched to 14.8x10⁹ barrels for the Verhulst fit which is about the same as the 2014 reported reserves amount (~4.4x10⁹ barrels) plus the amount already extracted (~10.8x10⁹ barrels).
|
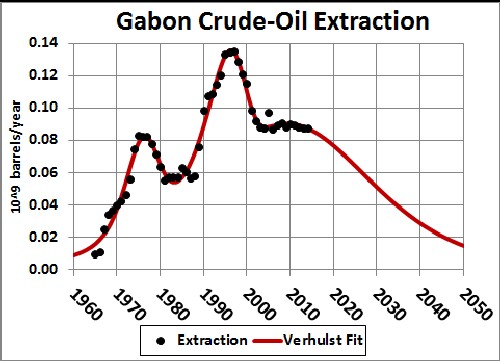
Gabon crude-oil extractionThe total amount to be extracted was set at 6x10⁹ barrels for the Verhulst fit which is about the same as the 2014 reported reserves amount (~2x10⁹ barrels) plus the amount already extracted (~4.07x10⁹ barrels).
|
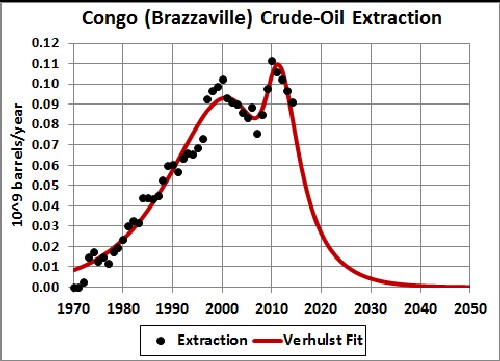
Congo (Brazzaville) crude-oil extractionThe total amount to be extracted searched to 3.08x10⁹ barrels for the Verhulst fit, which is somewhat smaller than the 2014 reported reserves amount (~1.6x10⁹ barrels) plus the amount already extracted (~2.7x10⁹ barrels).
|
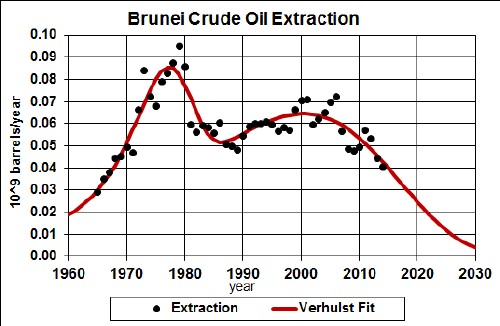
Brunei crude-oil extractionThe total amount to be extracted searched to 3.69x10⁹ barrels for the 2-Verhulst fit, which is considerably smaller than the 2013 reported reserves amount (~1.1x10⁹ barrels) plus the amount already extracted (~3.3x10⁹ barrels.
|
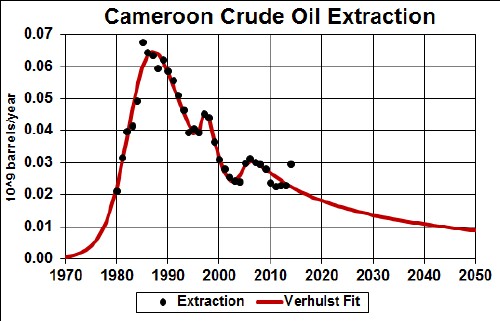
Cameroon crude-oil extractionThe total amount to be extracted searched to 2.37x10⁹ barrels for the Verhulst fit, which is larger than the 2014 reported reserves amount (~0.2x10⁹ barrels) plus the amount already extracted (~1.41x10⁹ barrels).
|
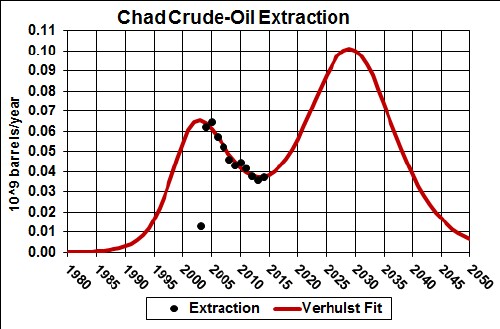
Chad crude-oil extractionThe total amount to be extracted was set to 3x10⁹ barrels for the Verhulst fit, which is larger than the 2014 reported reserves amount (~1.5x10⁹ barrels) plus the amount already extracted (~0.94x10⁹ barrels). The future peak was assumed to be symmetrical.
|
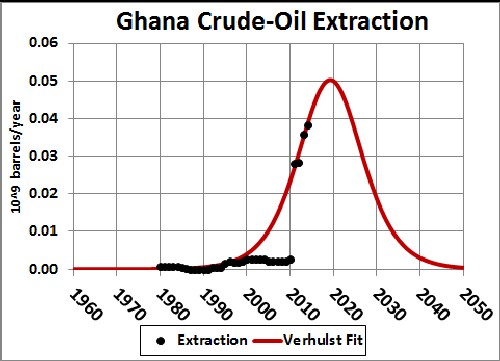
Ghana crude-oil extractionThe total amount to be extracted was set to 1x10⁹ barrels for the Verhulst fit, which is larger than the 2014 reported reserves amount (~0.66x10⁹ barrels) plus the amount already extracted (~0.172x10⁹ barrels). The final peak was assumed to be symmetrical.
|
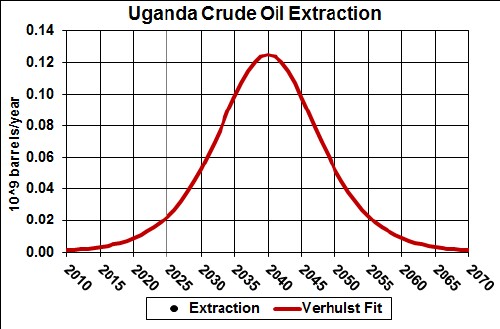
Uganda crude-oil extractionThe total amount to be extracted was set to 2.5x10⁹ barrels for the Verhulst fit, which is the same as the 2014 reported reserves amount (~2.5x10⁹ barrels). The peak was assumed to be symmetrical.
|
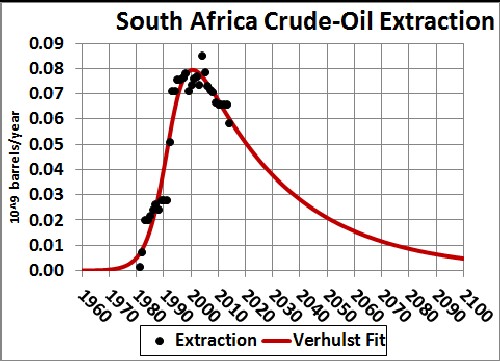
South Africa crude-oil extractionThe total amount to be extracted searched to 3.91x10⁹ barrels for the Verhulst fit, which is larger than the 2014 reported reserves amount (~0.015x10⁹ barrels) plus the amount already extracted (~1.86x10⁹ barrels).
|
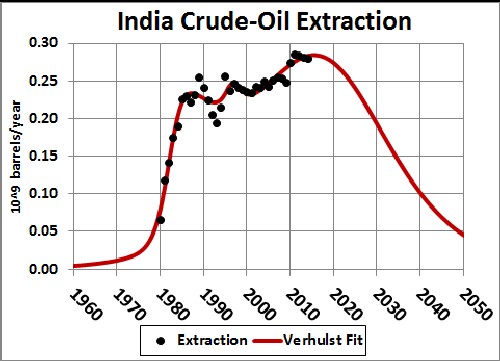
India crude-oil extractionThe total amount to be extracted was set to 15x109 barrels for the Verhulst fit, which is about the same as the 2014 reported reserves amount (~5.6x10⁹ barrels) plus the amount already extracted (~8.3x10⁹ barrels). The final peak was assumed to be symmetrical.
|
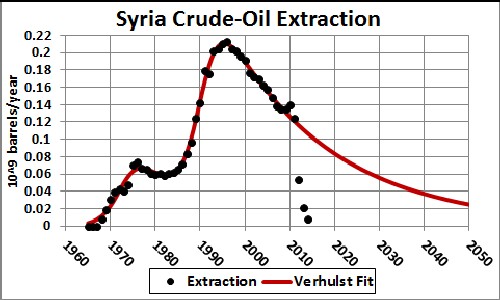
Syria crude-oil extractionThe total amount to be extracted was set at 8x10⁹ barrels for the Verhulst fit, which is about the same as the 2014 reported reserves amount (~2.5x10⁹ barrels) plus the amount already extracted (~5.2x10⁹ barrels).
The last three years' values, due to the civil war, were not used in making the fit. |
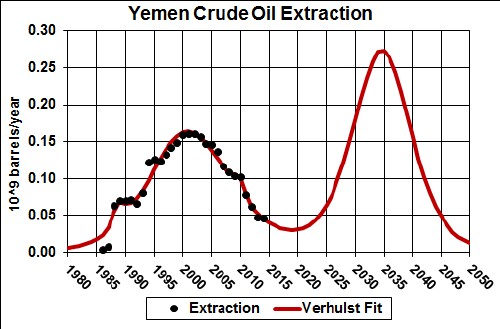
Yemen crude-oil extractionThe total amount to be extracted was set at 7x10⁹ barrels for the Verhulst fit, which is slightly larger tan the 2014 reported reserves amount (~3x10⁹ barrels) plus the amount already extracted (~3x10⁹ barrels). The final peak is assumed to be symmetrical.
|
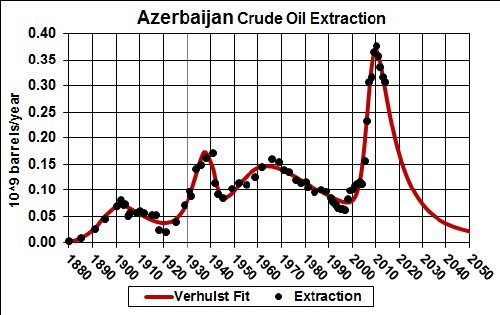
Azerbaijan crude-oil extractionThe total amount to be extracted searched to 17.8x10⁹ barrels for the Verhulst fit, which is slightly less than the 2014 reported reserves amount (~7x10⁹ barrels) plus the amount already extracted (~13.8x10⁹ barrels).
|
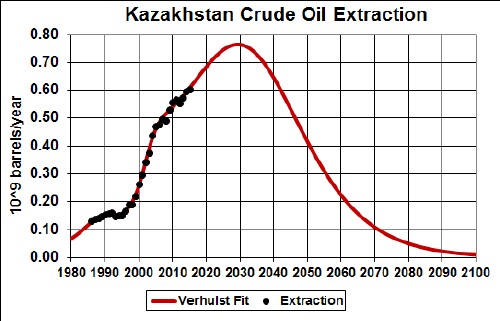
Kazakhstan crude-oil extractionThe total amount to be extracted was set at 40x109 barrels for the Verhulst fit, which is about the same as the 2014 reported reserves amount (~30x109 barrels) plus the amount already extracted (~9.9x10⁹ barrels). The future peak was assumed to be symmetrical.
|
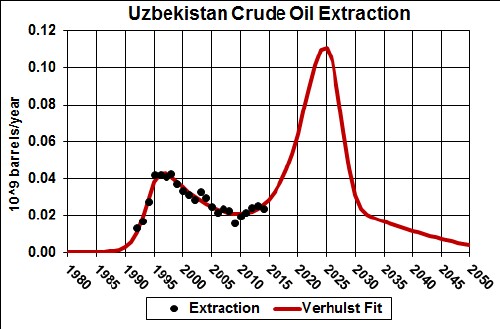
Uzbekistan crude-oil extractionThe total amount to be extracted was set at 2x10⁹ barrels for the Verhulst fit which is larger than the 2014 reported reserves amount (~0.594x10⁹ barrels) plus the amount already extracted (~0.641x10⁹ barrels). The future peak is assumed to be symmetrical.
|
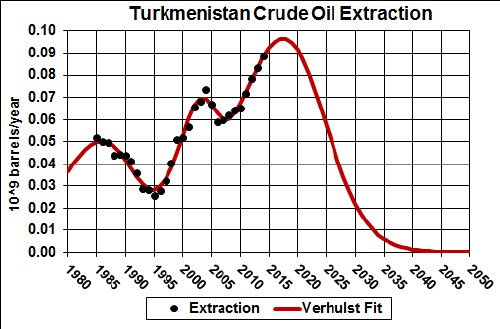
Turkmenistan crude-oil extractionThe total amount to be extracted was set at 5x10⁹ barrels for the Verhulst fit which is much larger than the 2014 reported reserves amount (~0.6x10⁹ barrels) plus the amount already extracted (~2.04x10⁹ barrels). The final peak is assumed to be symmetrical.
It would be helpful to have extraction data before 1980. |
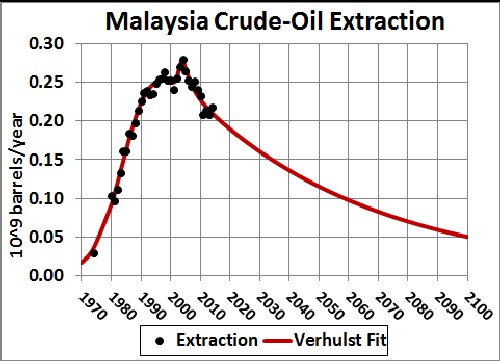
Malaysia crude-oil extractionThe total amount to be extracted searched to 20.5x10⁹ barrels for the Verhulst fit, which is slightly larger than the 2014 reported reserves amount (~4x10⁹ barrels) plus the amount already extracted (~12.8x10⁹ barrels).
|
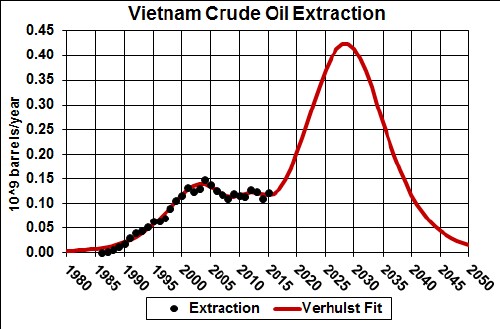
Vietnam crude-oil extractionThe total amount to be extracted was set to 10x109 barrels for the Verhulst fit, which is larger than the 2014 reported reserves amount (~4.4x10⁹ barrels) plus the amount already extracted (~2.6x10⁹ barrels). The future peak is assumed to be symmetrical.
|
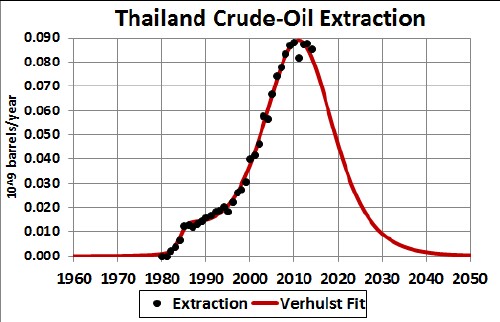
Thailand crude-oil extractionThe total amount to be extracted was set to 2x10⁹ barrels for the Verhulst fit which is slightly larger than the 2014 reported reserves amount (~0.4488x10⁹ barrels) plus the amount already extracted (~1.32x10⁹ barrels). The peak was assumed to be symmetrical.
|
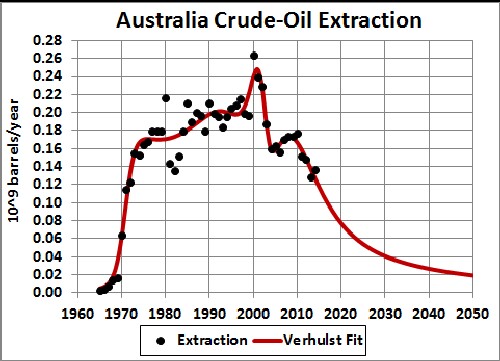
Australia crude-oil extractionThe total amount to be extracted searched to 10.3x10⁹ barrels for the Verhulst fit which is about the same as the 2014 reported reserves amount (~1.4x10⁹ barrels) plus the amount already extracted (~8.0x10⁹ barrels).
|
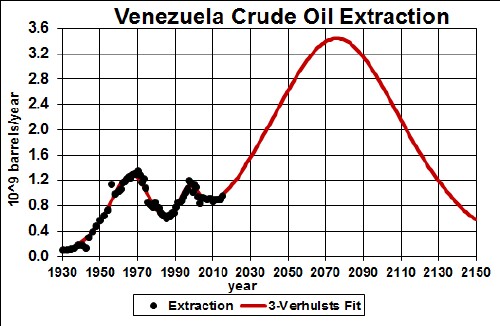
Venezuela crude-oil extractionThe total amount to be extracted was set at 375x109 barrels for the single-Verhulst fit, which is slightly larger than the 2014 reported reserves amount (~298x109 barrels) plus the amount already extracted (~67x109 barrels). The final peak is assumed to be symmetrical.
The future peak is mostly heavy oil. |
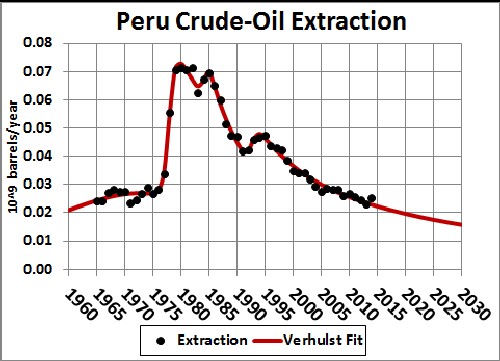
Peru crude-oil extractionThe total amount to be extracted searched to 3.97x10⁹ barrels for the Verhulst fit which is larger than the 2014 reported reserves amount (~0.6329x10⁹ barrels) plus the amount already extracted (~2.47x10⁹ barrels).
|
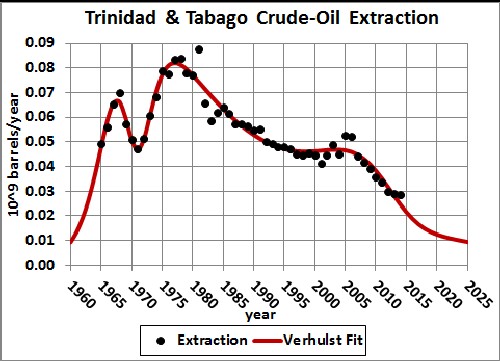
Trinidad & Tobago crude-oil extractionThe total amount to be extracted searched to 3.2x10⁹ barrels for the 3-Verhulst fit which is slightly smaller than the 2014 reported reserves amount (~0.73x10⁹ barrels) plus the amount already extracted (~2.8x10⁹ barrels).
|
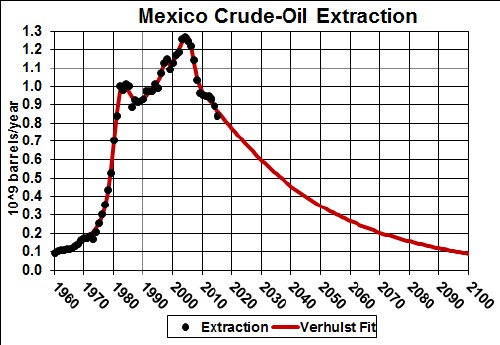
Mexico crude-oil extraction.For the Verhulst fit the total amount to be extracted searched to 59x109 barrels which is slightly larger than the 2014 reported reserves amount (~10x109 barrels) plus the amount already extracted (~38.1x10⁹ barrels).
References: |
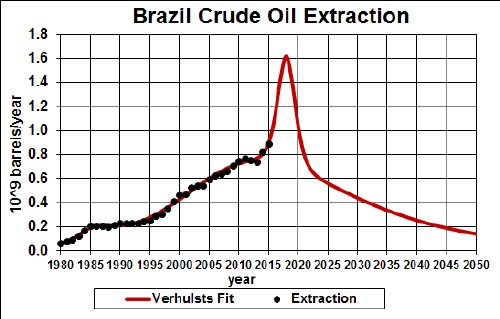
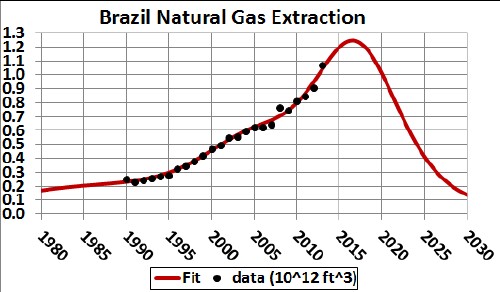
Brazil crude-oil extractionThe total amount to be extracted was set to 35x109 barrels which is slightly greater than the 2014 reported reserves amount (~13.2x10⁹ barrels) plus the amount already extracted (~14.7x10⁹ barrels). The final peak is assumed to be symmetrical.
The reserves used in this calculation was posted by the U.S. Energy Information Agency in 2013. Obviously, it does not include the recent off-shore discoveries called Pre-sal, with estimates up to 100x109 barrels. The best article I found about Pre-sal is :http://www.economist.com/displayStory.cfm?story_id=13348824. I think that it is very uncertain as to how much oil can actually be recovered from Pre-sal. The Economist article mentions many problems with extracting oil from Pre-sal. Countries almost always greatly exaggerate oil discoveries. 50x109 barrels or more would be an amazing discovery. None that large have been discovered for over 40 years. I don't believe the numbers given by Petrobras for the Pre-sal discovery. |
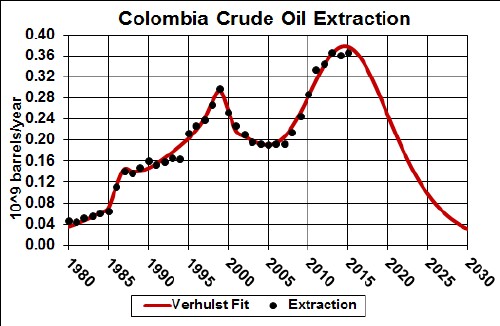
Colombia crude-oil extractionThe total amount to be extracted was set at 10x109 barrels for the Verhulst fit which is slightly larger than the 2014 reported reserves amount (~2.4x10⁹ barrels) plus the amount already extracted (~7.1x10⁹ barrels). The final peak is assumed to be symmetric.
|
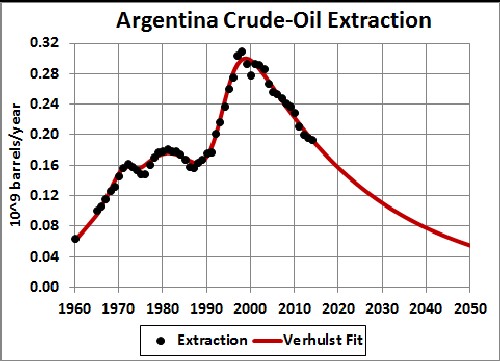
Argentina crude-oil extractionThe total amount to be extracted searched to 16.5x10⁹ barrels for the 3-Verhulst fit which is slightly larger than the 2014 reported reserves amount (~2.8x10⁹ barrels) plus the amount already extracted (~11.0x10⁹ barrels).
|
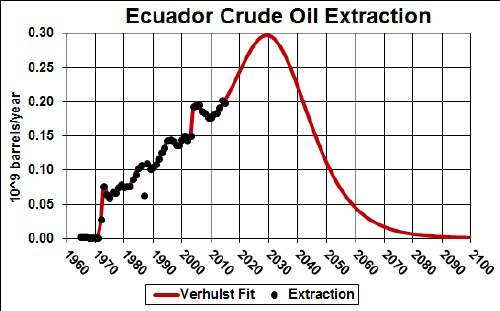
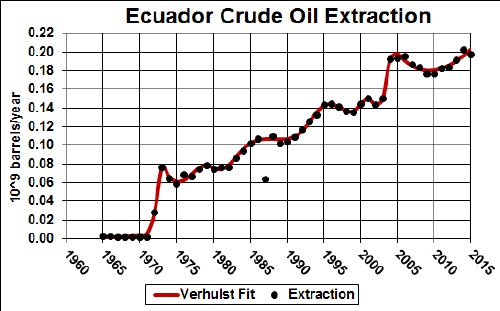
Ecuador crude-oil extractionThe total amount to be extracted was set to 15x109 barrels for the Verhulst fit which is slightly larger than the 2014 reported reserves amount (~8.24x10⁹ barrels) plus the amount already extracted (~5.5x1109 barrels). The final peak is assumed to be symmetrical.
|
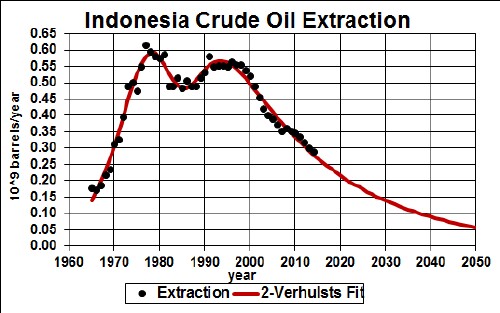
Indonesia crude-oil extractionThe total amount to be extracted searched to 29.2x10⁹ barrels for the 2-Verhulst fit which is slightly larger than the 2014 reported reserves amount (~3.59x10⁹ barrels) plus the amount already extracted (~22.8x10⁹ barrels).
|
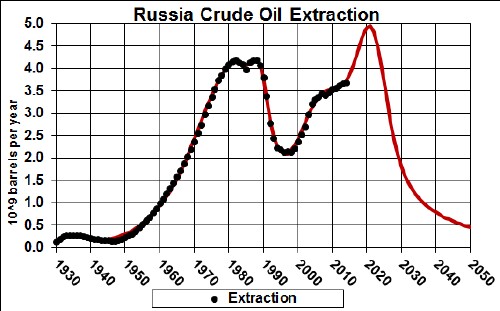
Soviet-Union/Russia crude-oil extraction.The total amount to be extracted was set to 260x109 barrels which is about the same as the 2014 reserves estimate of ~80x109 barrels plus the amount already extracted (~173x109 barrels).
Of course, the first peak is for the entire Soviet Union and the second peak is for Russia alone. |
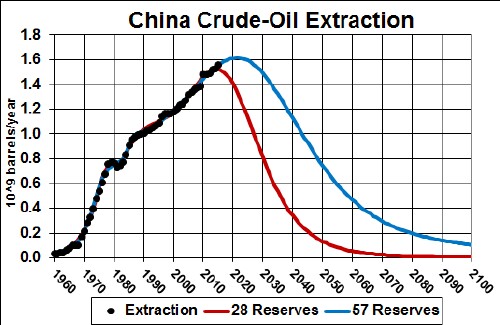
China crude-oil extractionThe red-curve Verhulst fit was set at Q=75x109 barrels, which is slightly more than 2015 reserves of 24.6x10⁹ barrels and ~46.7.3x109 barrels already extracted. However, a better fit was obtained with a reserves value of 66.5 x10⁹ barrels, the blue curve.
|
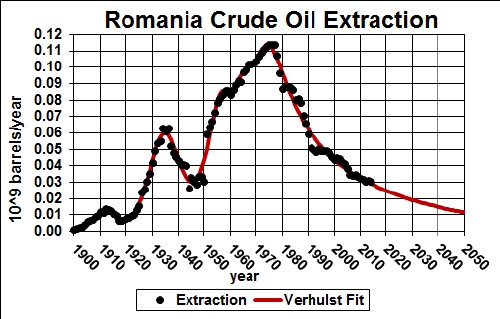
Romania crude-oil extractionThe total amount to be extracted searched to 6.9x10⁹ barrels for the Verhulst fit which is slightly larger than the 2014 reported reserves amount (~0.6x10⁹ barrels) plus the amount already extracted (~5.8x10⁹ barrels)..
|
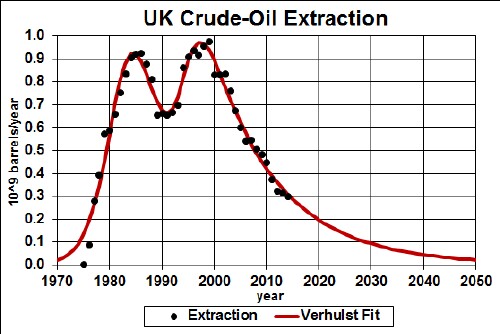
United Kingdom crude-oil extractionThe total amount to be extracted for a 2-Verhulst fit searched to Q=30.3x10⁹ barrels, which is slightly more than the reported reserves amount (2.98x10⁹ barrels) plus the amount already extracted (~26.1x10⁹ barrels)
|
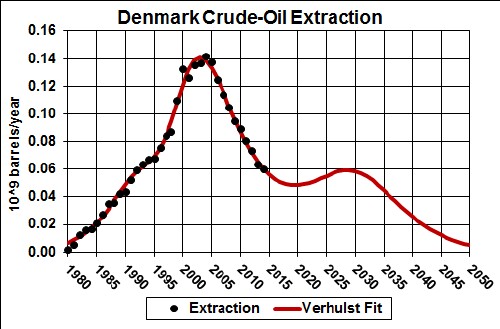
Denmark crude-oil extractionThe total amount to be extracted for a Verhulst fit was set to Q=4x10⁹ barrels, which is slightly larger than the 2014 reported reserves amount (~0.8051x10⁹ barrels) plus the amount already extracted (~2.54x10⁹ barrels). The future peak is assumed to be symmetrical.
|
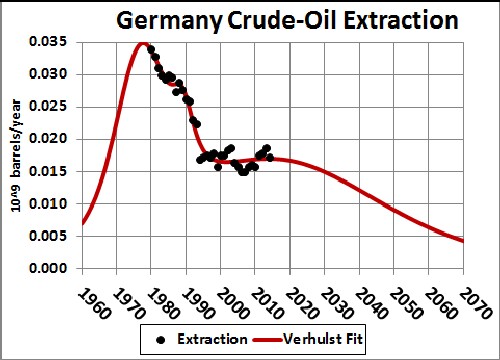
Germany crude-oil extractionThe total amount to be extracted for a Verhulst fit was set to to Q=2x10⁹ barrels, which is larger than the 2014 reported reserves amount (~0.2326x10⁹ barrels) plus the amount already extracted (~1.3x10⁹ barrels). The initial and final peaks were assumed to be symmetrical.
|
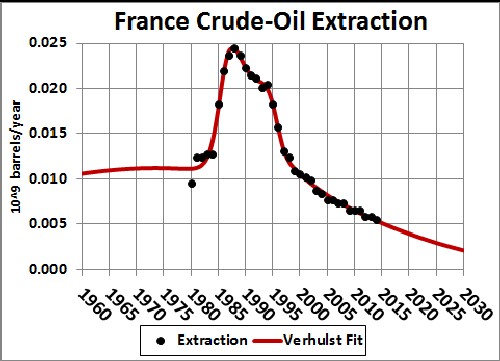
France crude-oil extractionThe total amount to be extracted for a Verhulst fit searched to Q=1.3x10⁹ barrels, which is slightly larger than the 2014 reported reserves amount (~0.08957x10⁹ barrels) plus the amount already extracted (~1.2x10⁹ barrels).
|
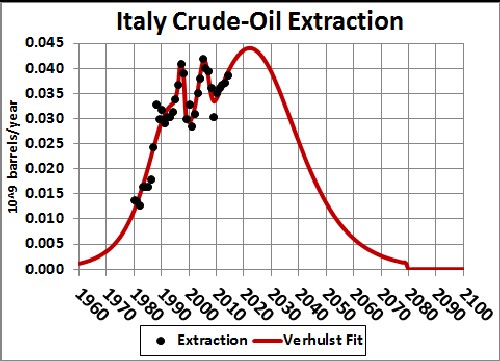
Italy crude-oil extractionThe total amount to be extracted for a Verhulst fit was set to Q=2.5x10⁹ barrels, which is larger than the 2014 reported reserves amount (~0.5605x10⁹ barrels) plus the amount already extracted (~1.1x10⁹ barrels). The future peak was assumed to be symmetrical.
|
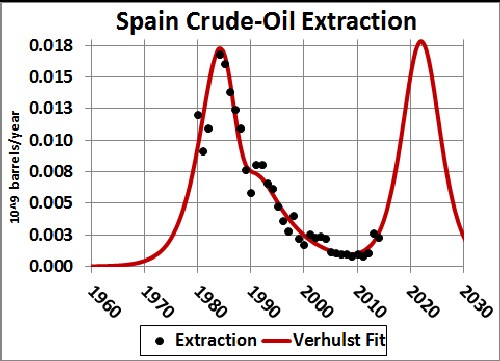
Spain crude-oil extractionThe total amount to be extracted for a Verhulst fit was set to 0.4x10⁹ barrels, which is slightly larger than the 2014 reported reserves amount (~0.15x10⁹ barrels) plus the amount already extracted (~0.21x10⁹ barrels). The future peak was assumed to be symmetrical.
|
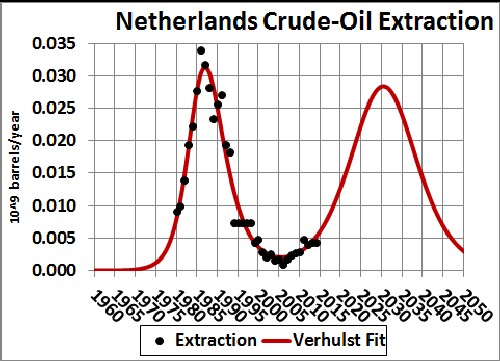
Netherlands crude-oil extractionThe total amount to be extracted for a Verhulst fit was set to Q=1x10⁹ barrels, which is larger than the 2014 reported reserves amount (~0.3026x10⁹ barrels) plus the amount already extracted (~0.41x10⁹ barrels).
|
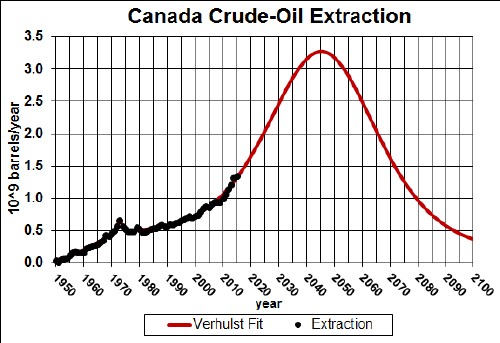
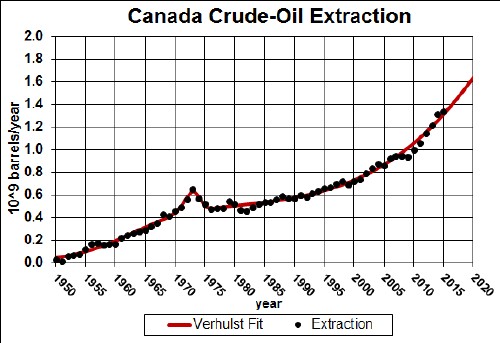
Canada crude-oil extractionThe 2014 reserves value is ~173x109 barrels. This fit uses a value slightly larger than that:
|
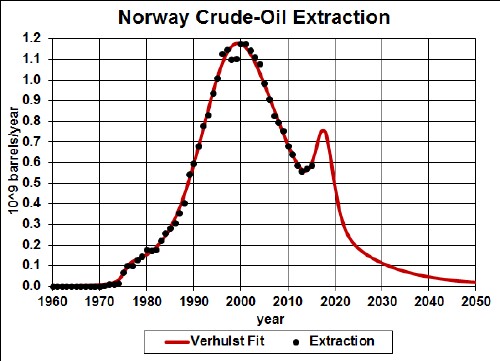
Norway crude-oil extractionThe 2014 reserves reported for Norway (5.825x10⁹ barrels) is about the same as the set Q value (32x109 barrels) minus the amount already extracted (~25.6x10⁹ barrels). |
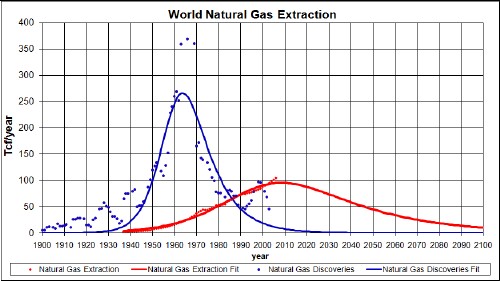
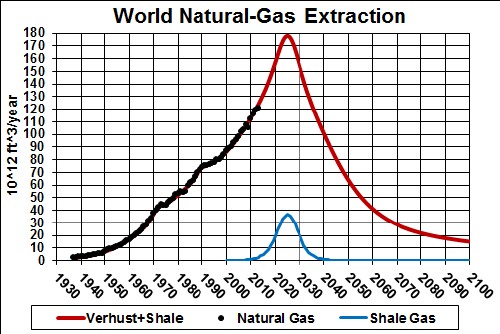
World Natural-Gas DiscoveriesThis and the curve below for world natural-gas extraction were fitted together with a common value for amount eventually discovered and extracted (7.8x1015 ft3). |
Comparison of world natural-gas discoveries and extraction. This graph contains information that probably will have the greatest effect on those now living and born in the future. Natural gas cannot be extracted if it has not been discovered! This graph shows very clearly why it is very unlikely that the final amount to be extracted will exceed 8x1015 ft3. So far the amount extracted is about 3x1015 ft3, so we are more than one-third of the way there!
The amount to be eventually extracted was set to 10.5x1015 ft3, which is slightly larger than the sum of the 2012 reserves (~6.845x1015 ft3) and the amount already extracted (~3.5x1015 ft3) This does not include uncertain shale gas; see below. |
Adding in uncertain shale gas:
The short large blip is an estimate of shale gas extraction . So, shale natural gas may add a short large blip to the natural-gas extraction for the World. It could be reduced in size and stretched out over a larger time interval, but I doubt it will be. The world will probably extract and use it as fast as possible. |
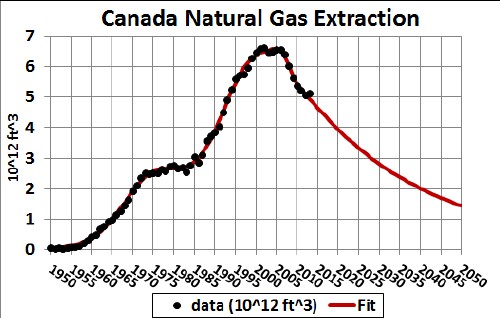
Canada Natural-Gas Extraction
|
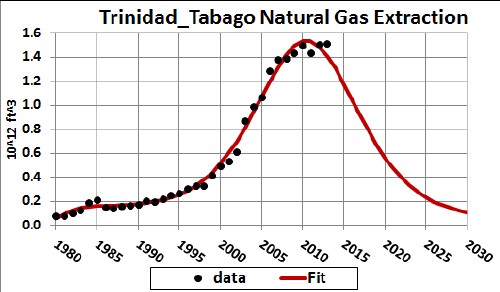
Trinidad and Tabago Natural-Gas Extraction
|
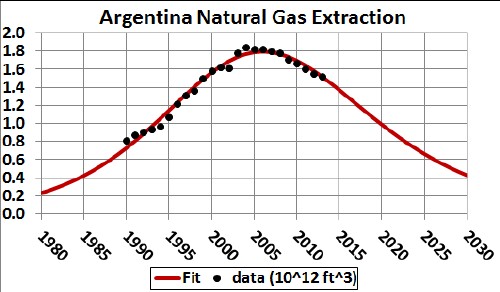
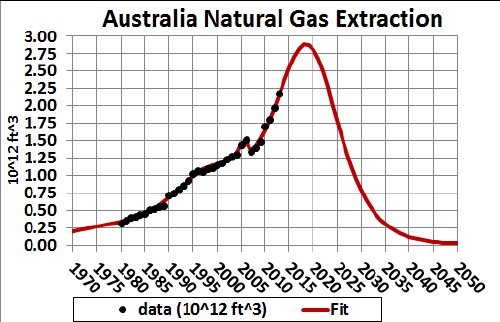
Australia Natural-Gas Extraction
|
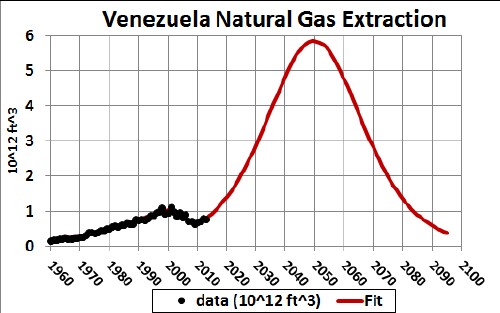
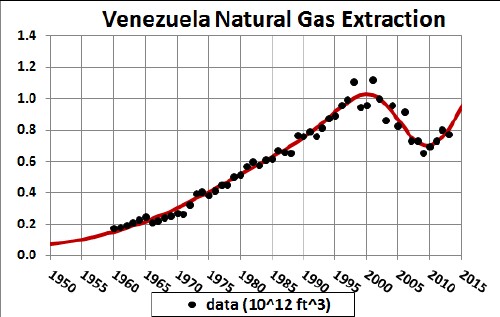
Venezuela Natural-Gas Extraction
|
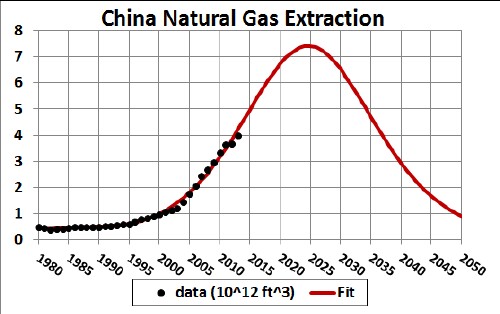
China Natural-Gas Extraction
|
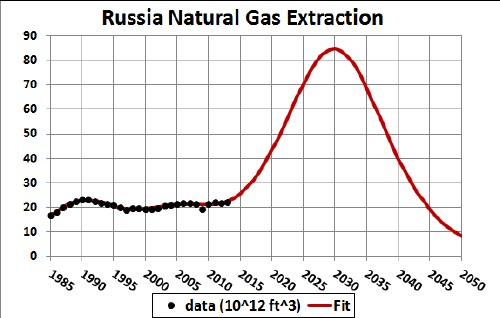
Russia Natural-Gas Extraction
|
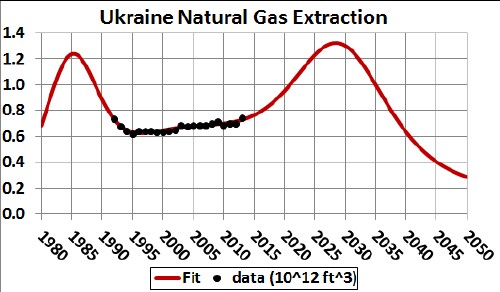
Ukraine Natural-Gas Extraction
|
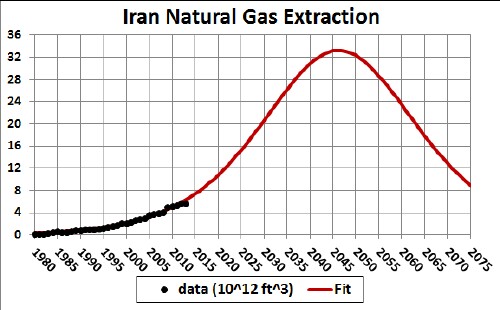
Iran Natural-Gas Extraction
|
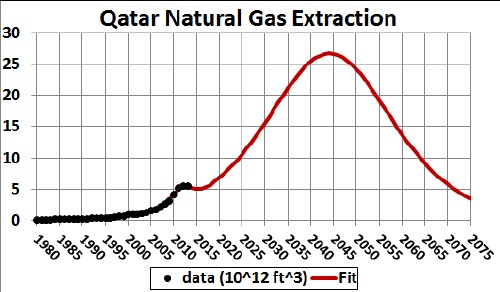
Qatar Natural-Gas Extraction
|
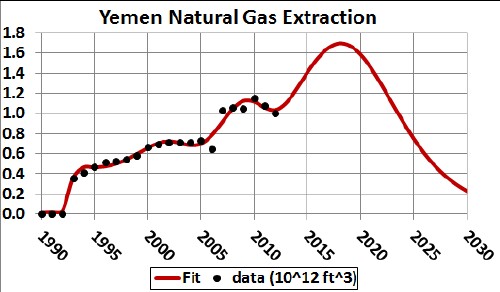
Yemen Natural-Gas Extraction
|
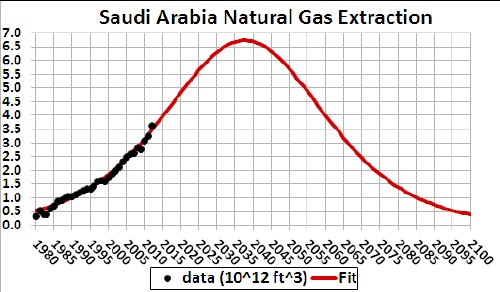
Saudi Arabia Natural-Gas Extraction
|
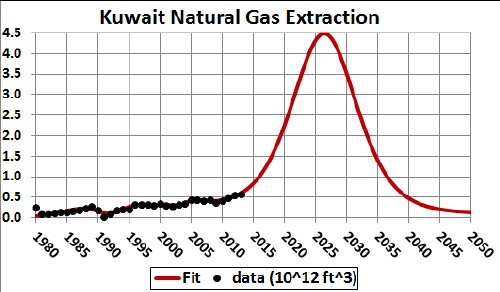
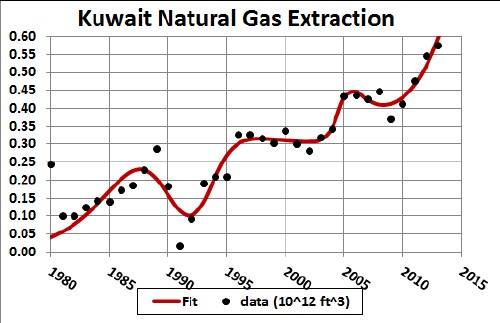
Kuwait Natural-Gas Extraction
|
UAE Natural-Gas Extraction
|
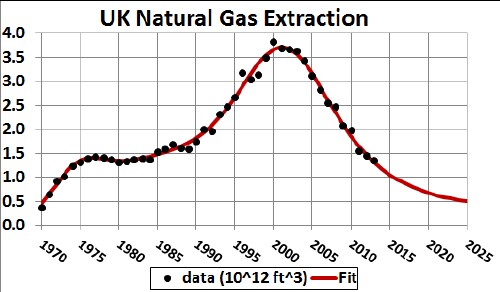
UK Natural-Gas Extraction
|
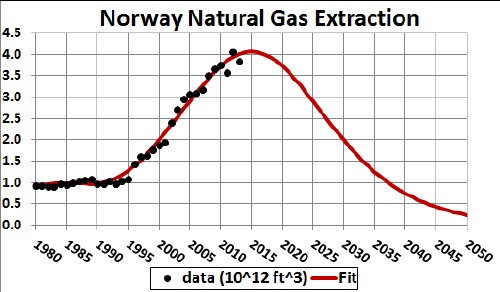
Norway Natural-Gas Extraction
|
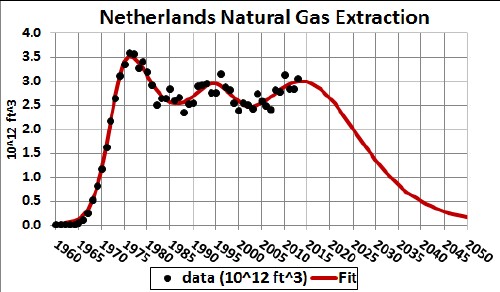
Netherlands Natural-Gas Extraction
|
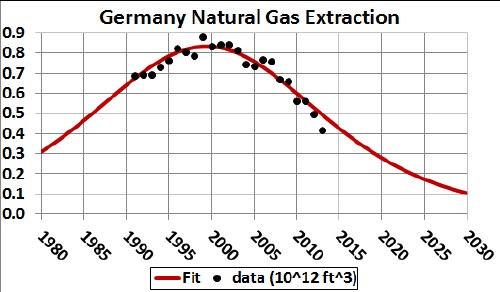
Germany Natural-Gas Extraction
|
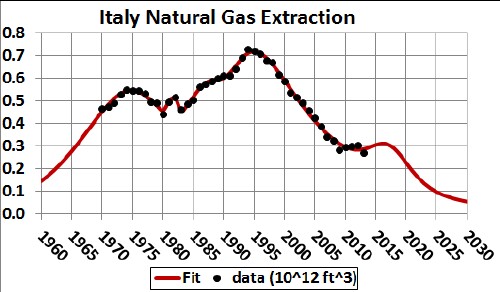
Italy Natural-Gas Extraction
|
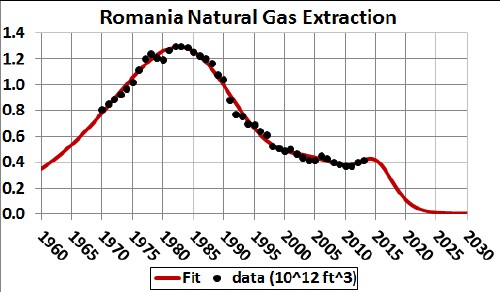
Romania Natural-Gas Extraction
|
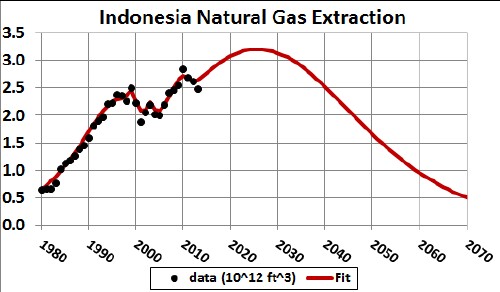
Indonesia Natural-Gas Extraction
|
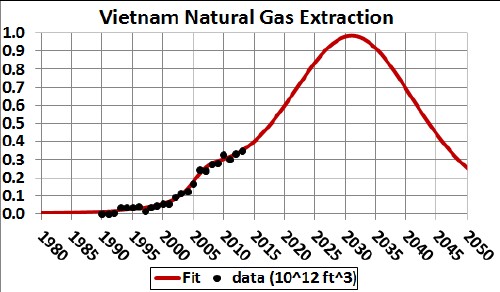
Vietnam Natural-Gas Extraction
|
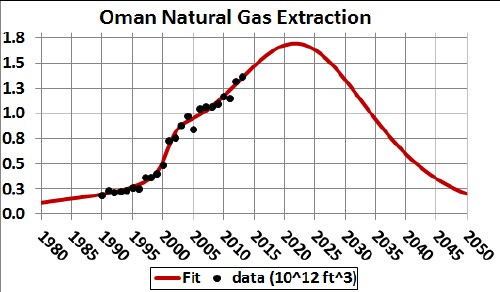
Oman Natural-Gas Extraction
|
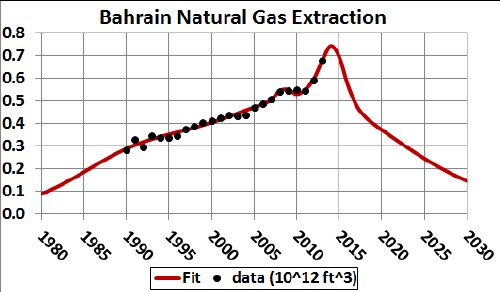
Bahrain Natural-Gas Extraction
|
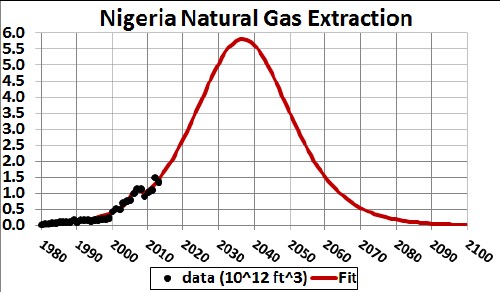
Nigeria Natural-Gas Extraction
|
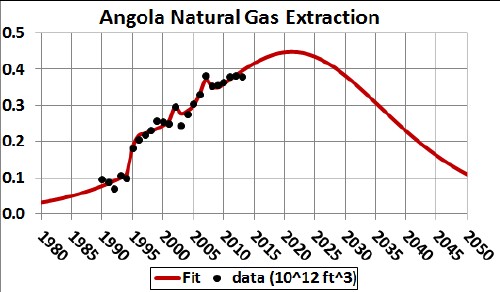
Angola Natural-Gas Extraction
|
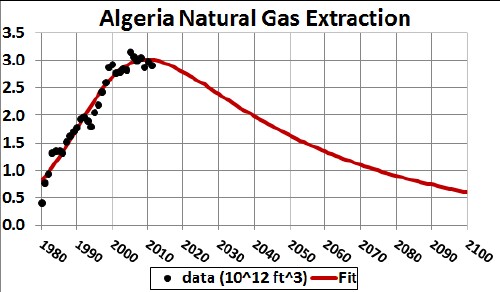
Algeria Natural-Gas Extraction
|
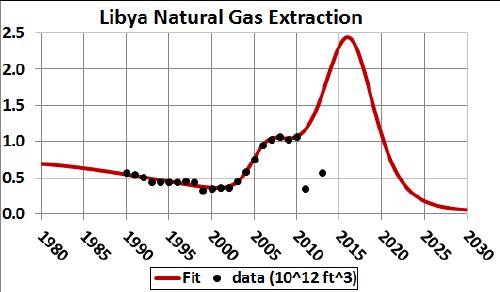
Libya Natural-Gas Extraction
|
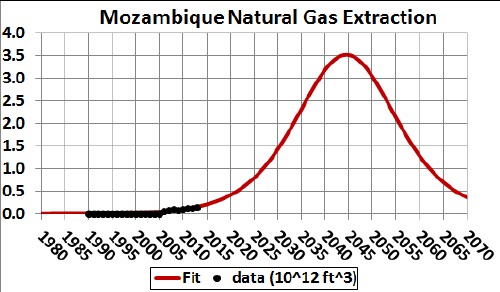
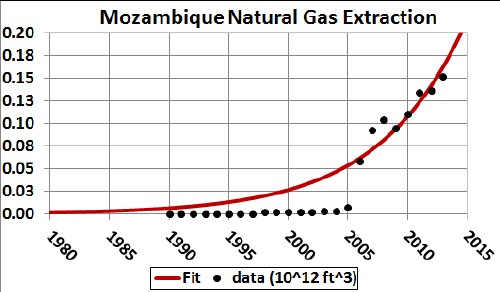
Mozambique Natural-Gas Extraction
|
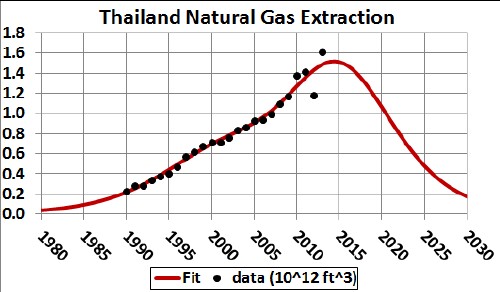
Thailand Natural-Gas Extraction
|
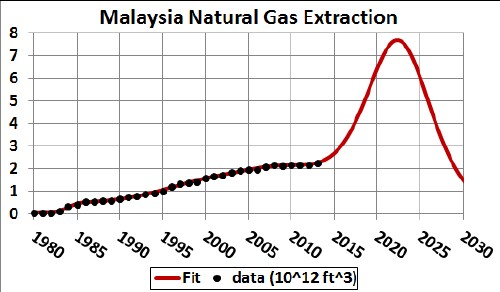
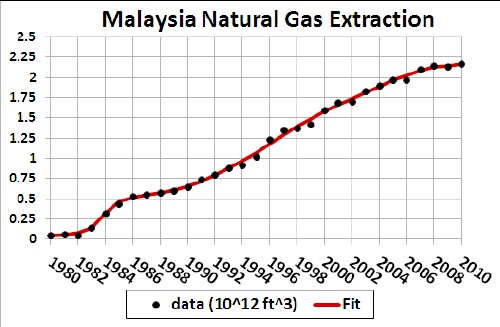
Malaysia Natural-Gas Extraction
|
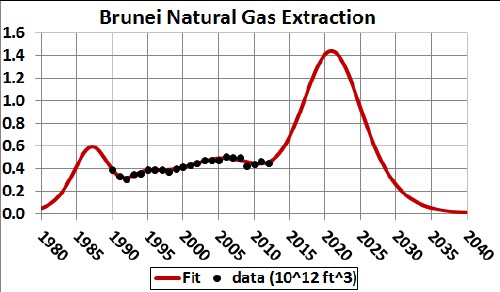
Brunei Natural-Gas Extraction
|
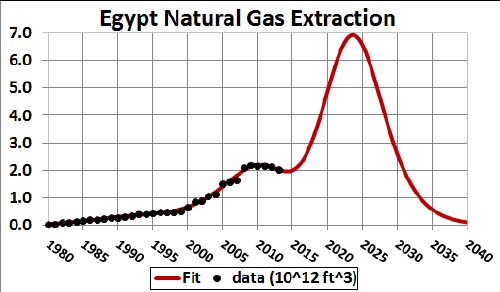
Egypt Natural-Gas Extraction
|
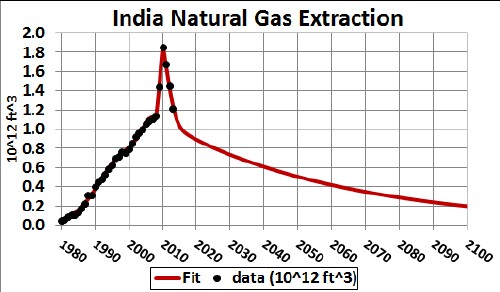
India Natural-Gas Extraction
|
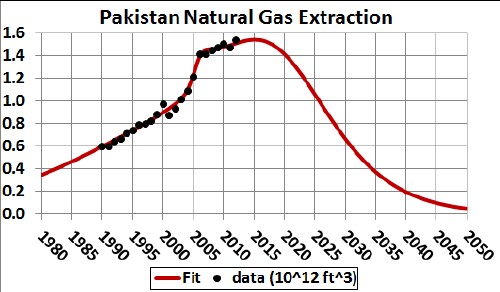
Pakistan Natural-Gas Extraction
|
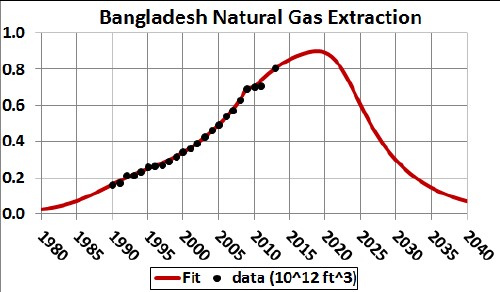
Bangladesh Natural-Gas Extraction
|
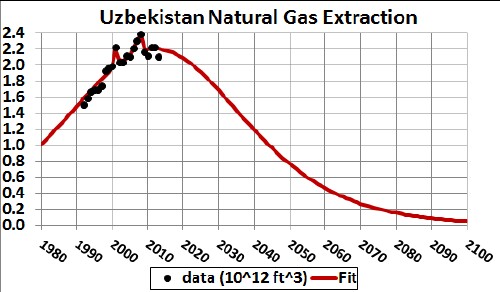
Uzbekistan Natural-Gas Extraction
|
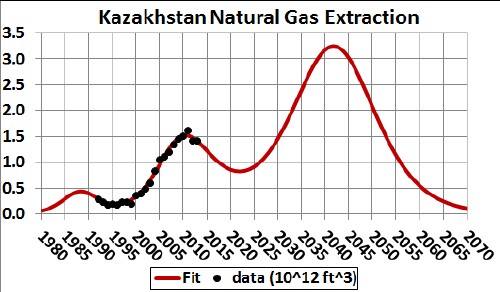
Kazakhistan Natural-Gas Extraction
|
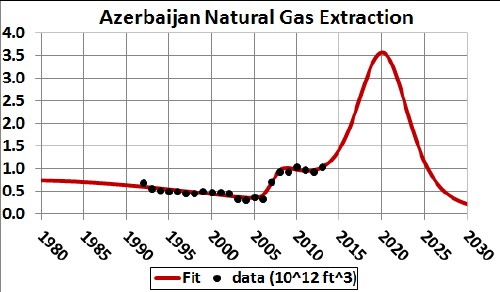
Azerbaijan Natural-Gas Extraction
|
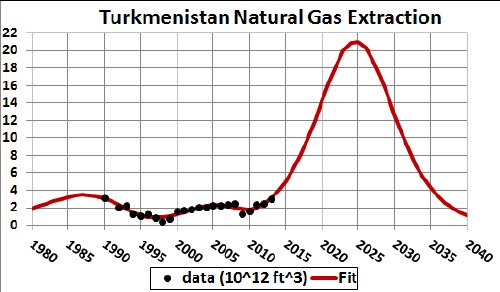
Turkmenistan Natural-Gas Extraction
|
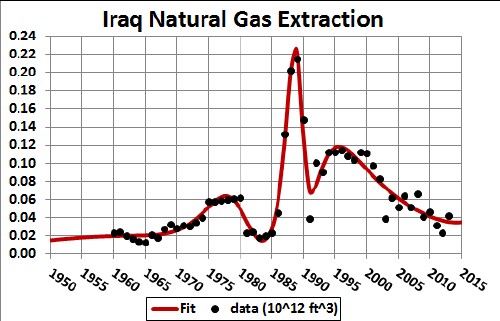
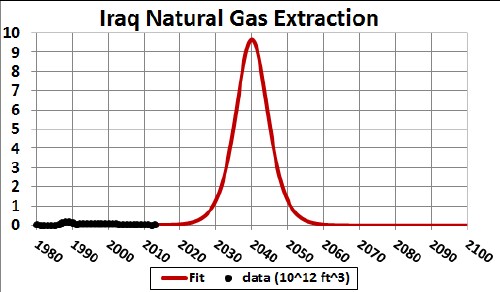
Iraq Natural-Gas Extraction
|
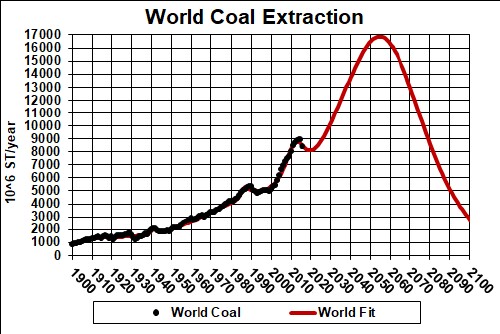
World Coal Extraction |
This Verhulst fit was made to extraction using the reserves estimate (948 x 109 short tons) from the USA EIA. There are some indications that the estimated reserves value is too high; if that is so, the peak will occur sooner than 2040. |
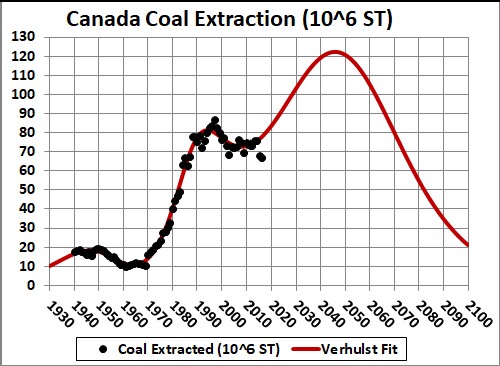
Canada Coal Extraction
|
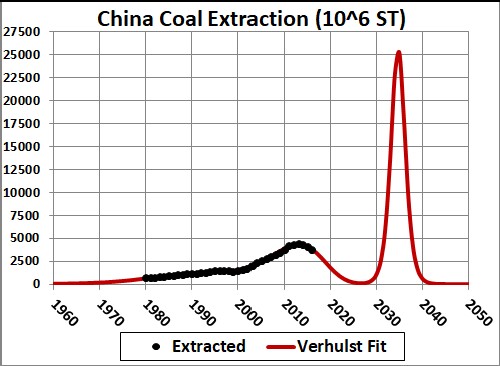
China Coal ExtractionThe 18 Nov 2010 issue of Nature (468, pp.367-369) gives two different possible values for coal reserves in China: 187 x 109 or 115 x 109 short tons. (The 2008 EIA estimate of reserves is 126.215 x 10⁹ short tons.) The following shows fits of the Verhulst function to the China coal extraction data for those two reserves values.
It either case coal extraction in China will peak around year 2020. Carbon capture in China: |
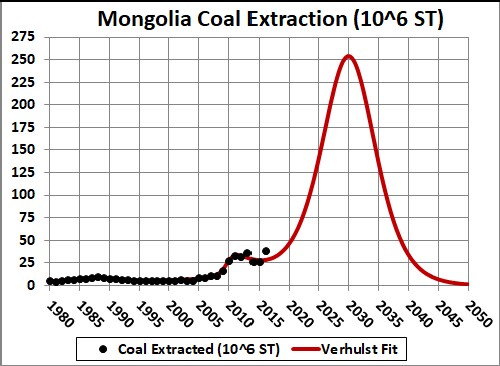
Mongolia Coal Extraction
|
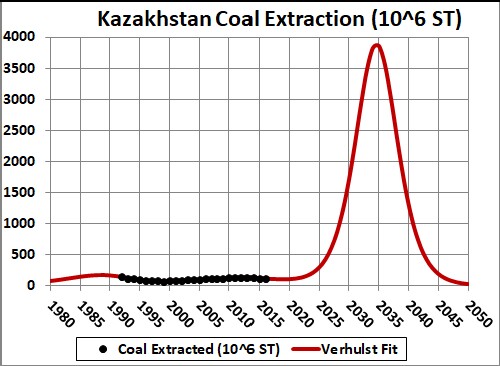
Kazakhstan Coal Extraction
The fit to the data uses slightly more than the 2016 reserves value ~33.6x10⁹ tons. |
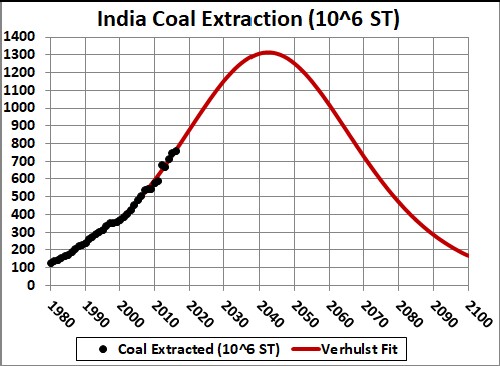
India Coal Extraction
|
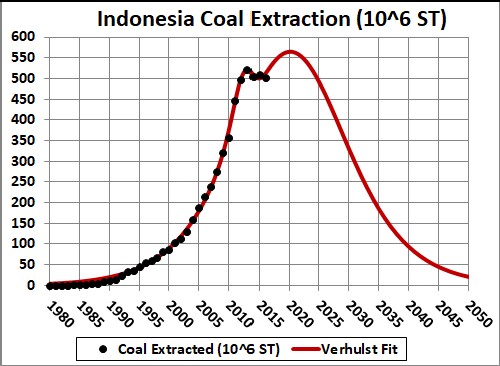
Indonesia Coal Extraction
|
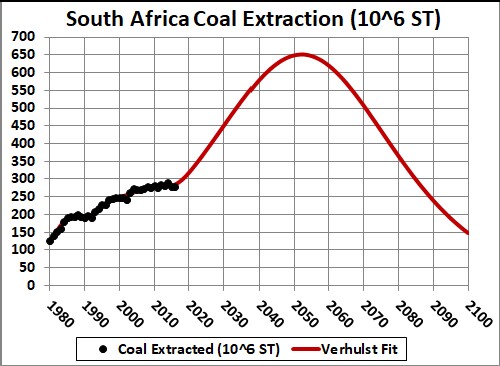
South Africa Coal Extraction
|
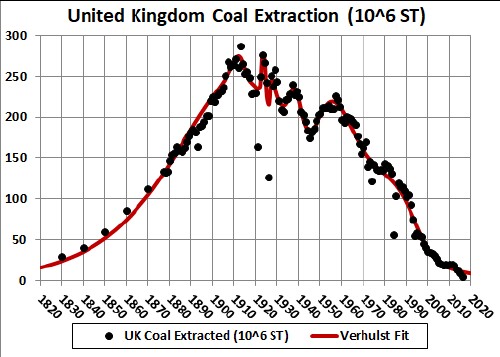
United Kingdom Coal ExtractionThe UK is a good example of coal depletion:
The data are taken from: |
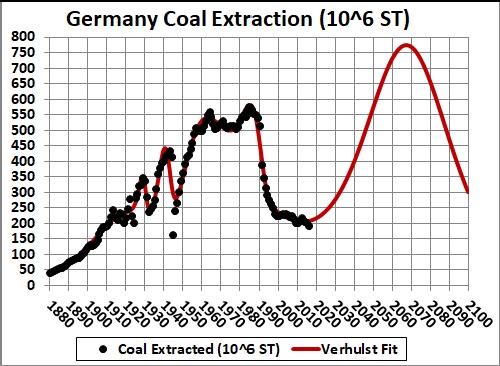
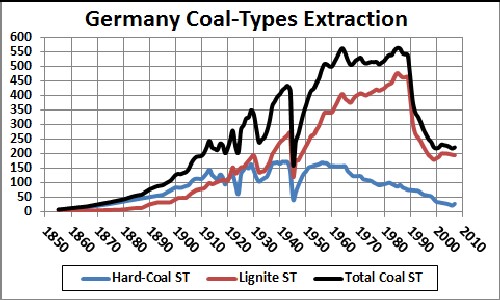
Germany Coal Extraction
|
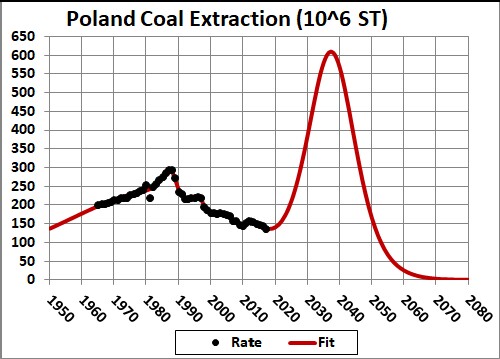
Poland Coal Extraction
|
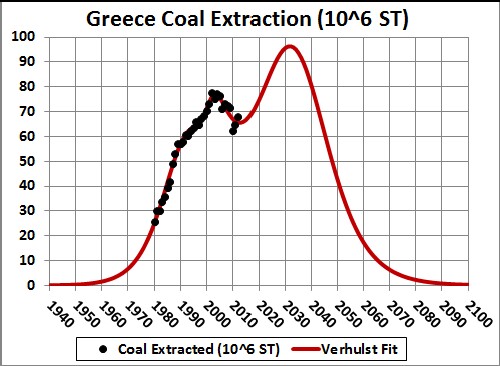
Greece Coal Extraction
|
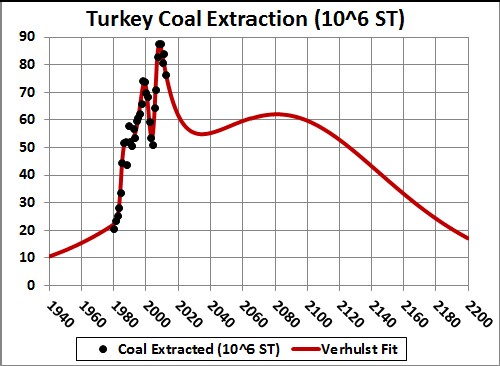
Turkey Coal Extraction
|
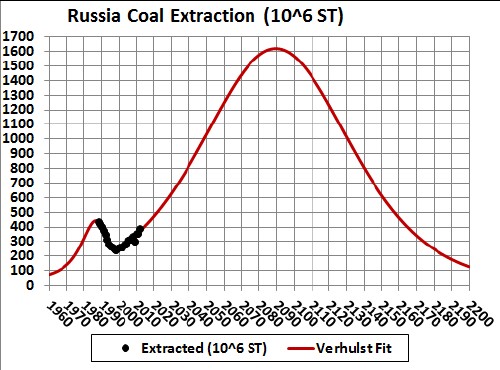
Russia Coal Extraction
|
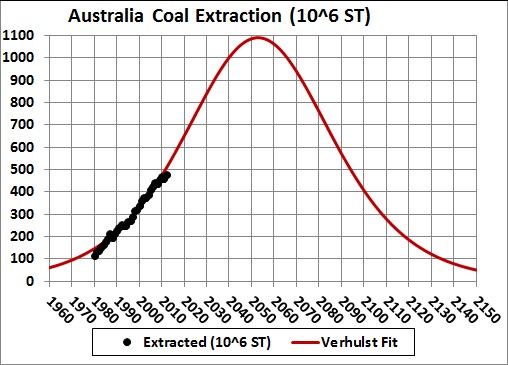
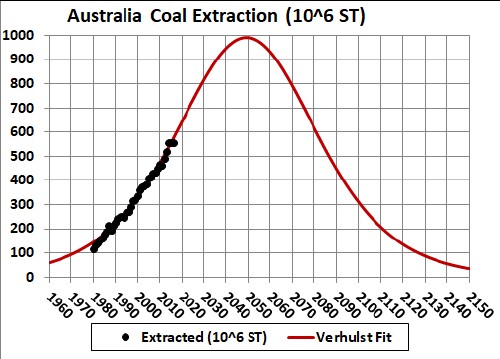
Australia Coal Extraction
|
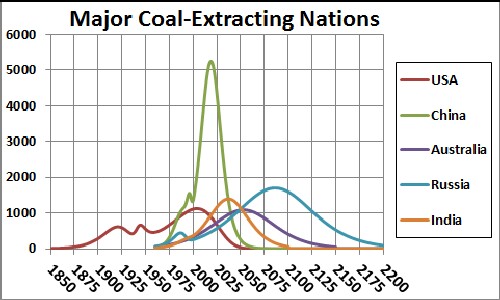
Major Coal-Extracting Nations |
Excel spreadsheet listing some of the data used in the analyses above
 l
l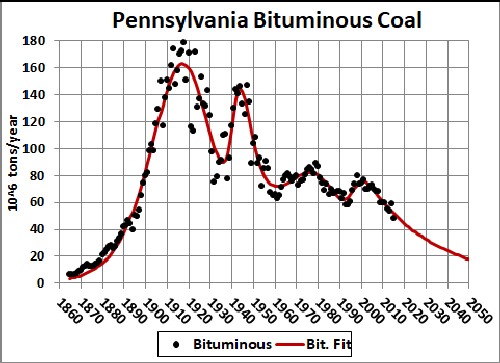
 /
/
 l
l